devtools
 devtools copied to clipboard
Performance tools for Flutter

[CPU Flame Chart - increase stack depth] There may be performance concerns for this. May inversely affect the sampling rate. How much should we increase it? It is currently at...
- [ ] Element tree - [ ] Render tree - https://github.com/flutter/devtools/issues/6603, https://github.com/flutter/devtools/issues/636 - [ ] Semantics tree - https://github.com/flutter/devtools/issues/1397 - [ ] Focus tree - https://github.com/flutter/devtools/issues/3634, https://github.com/flutter/devtools/issues/5326 - [...
During my internship, I didn't get to implement the logic for visualizing CrossAxisAlignment.baseline because more often than not the baseline of the Flex widget would be null and triggering the...
I'm not able to consistently set breakpoints in the debugger page.
The title header displays a time that is 4 hours later than EST. Header * File info * 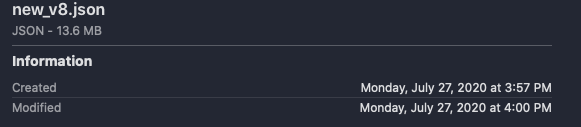
In the timeline, we were getting extremely long class names for stack frames. `_WidgetsFlutterBinding&BindingBase&GestureBinding&ServicesBinding&SchedulerBinding&PaintingBinding&SemanticsBinding&RendererBinding._handlePersistentFrameCallback` The important information here would be `_WidgetsFlutterBinding._handlePersistentFrameCallback`, and is what we show in the profiler UI...
Investigate doing something like what flutter/flutter does - solve for related packages at once, and them move those versions into the related pubspec / lock files. This is probably not...
Repro steps: - Add and trigger a breakpoint - Expand the variables in scope - Step Over - Observe variables are collapsed If we wanted to see the value of...
## Feature request AngularDart DevTools needs the means to jump to the Dart source for a given class in the Debugger view. ## Context In the JavaScript world, this is...
If a user selects a stack frame in the flame chart, then switches to the call tree or the bottom up view, the same stack frame should be selected and...