chaitanyaVadlamudi
chaitanyaVadlamudi
Initially I implemented with visualMap continuos, but it's not plotting the graph as expected. If required I can share the dataset which I'm using. **With visual map:** 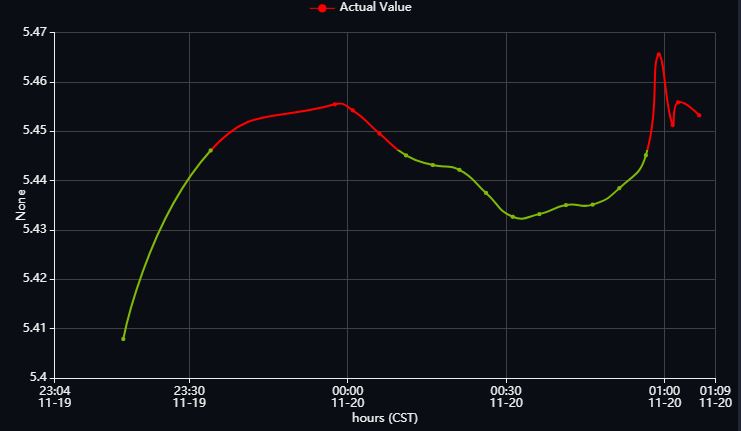 **Expected Behaviour:**...
Actually Color between two points are dependent on other parameter. Say there are three lists 1. [5,8,10,6,12] 2. ['2019-10-12T10:05:00.000Z','2019-10-12T10:10:00.000Z','2019-10-12T10:15:00.000Z','2019-10-12T10:20:00.000Z','2019-10-12T10:25:00.000Z'] 3. [3,1,2,1,2] Graph will be plotted between 1 and 2. The...
The color of the line is not dependent neither on values of y-axis nor on values of x-axis . So I can't use dimension to set the color. It's dependent...