Arduino-PID-Library
 Arduino-PID-Library copied to clipboard
PID library execution and wierd spikes in Signals
Hi Brett, since couple of weeks i'm working to understand the reason of the spikes in my PID controlled system but, without any success. As someone highly related to PID, maybe you could put some light into this darkness. Please have a look at the graph I plotted using the data from my Arduino Due. What could be the issue here?, maybe the function which drives the setpoint variable up and down?

The pid library doesn't write to the setpoint or input. Only the output. If your setpoint is moving it's because of something else.
On Thu, May 10, 2018, 4:46 PM Dave Zebrovski [email protected] wrote:
Hi Brett, since couple of weeks i'm working to understand the reason of the spikes in my PID controlled system but, without any success. As someone highly related to PID, maybe you could put some light into this darkness. Please have a look at the graph I plotted using the data from my Arduino Due. What could be the issue here?, maybe the function which drives the setpoint variable up and down?
[image: pid data graph] https://user-images.githubusercontent.com/25608157/39893374-c9ccbb8a-54a3-11e8-9ec7-25a3b523a0d8.jpg
— You are receiving this because you are subscribed to this thread. Reply to this email directly, view it on GitHub https://github.com/br3ttb/Arduino-PID-Library/issues/79, or mute the thread https://github.com/notifications/unsubscribe-auth/AAWL8ozRFCM7bg1bIMpireTntqLNvj-kks5txKcjgaJpZM4T6hs_ .
I have written such a function block inside my code to act as a setpoint. Actually it just simulates the change in Setpoint variable, in order to see how the system reacts to that. Could you please have a look at it. I cant see what is wrong there, also what might be related to that spikes in setpoint, the graph above.
            {
              static unsigned long start_millis = 0;
              unsigned long current_millis;
              const unsigned long hold_1 = 0.01;
              current_millis = millis();
                if (current_millis - start_millis >= hold_1)
                  {
                    start_millis += hold_1;
                      if(RampingUp)
                       {
                        setpoint += 0.01;
                        if (setpoint > 3.279)
                          {
                           setpoint = 3.279;
                           RampingUp = false;
                          }
                       }
                        else  // not RampingUp
                         {
                          setpoint -= 0.01;
                           if(setpoint < 0.0)
                            {
                             setpoint = 0.0;
                             RampingUp = true;
                            }
                         }
                   }
               }`
Here's some feedback on your function. Your loop is being run every 1 or more millisecond. This statement doesn't make sense:
if (current_millis - start_millis >= hold_1)
current_millis and start_millis are both integers. Their difference is either 0 or exceeds hold_1 which is a float with a value 0.01. Along those same lines, this statement has no effect:
start_millis += hold_1;
Again, start_millis is an int and hold_1 is a float that's assigned to 0.01. From your graph it seems like everything is working fine until around 500ms into the experiment. The behavior can't be explained based on the code you've shown. Look for other places where the setpoint is referenced. It's possible that you have a memory error (like overwriting the bounds of an array) that could be affecting setpoint too.
Also, the spikes are all in the setpoint. It's clear from the graph that changes in the setpoint preceed changes in the PID output.
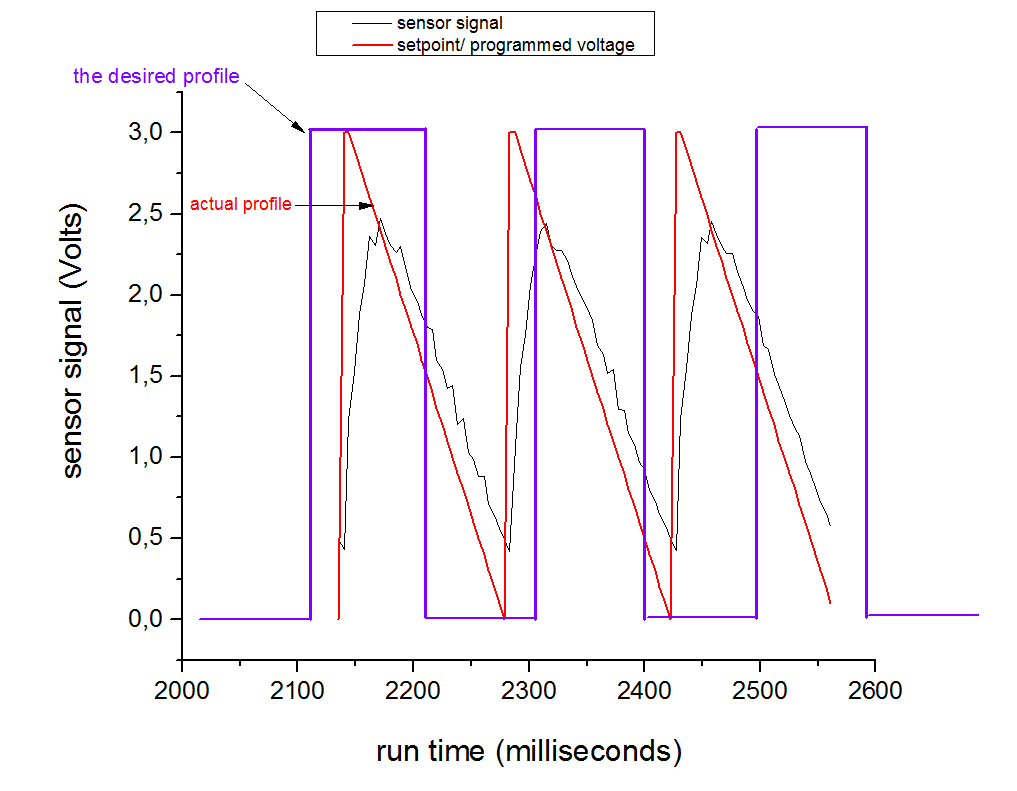 I was just wondering how the desired voltage profile can be programmed, so that it has a square wave geometry in graph the Violet line. It might be helpful to troubleshoot the issue. Any ideas would be of great appreciation.