orange3
 orange3 copied to clipboard
🍊 :bar_chart: :bulb: Orange: Interactive data analysis

##### Issue Closes gh-5816 ##### Description of changes Add option for no regularization. ##### Includes - [X] Code changes - [X] Tests - [ ] Documentation
**What's wrong?** We got a 55 dimensional dataset and are choosing 5 features to create a (neural network) model ignoring the remaining 50 dimensions. When testing the model with via...
##### Issue ##### Description of changes ##### Includes - [X] Code changes - [ ] Tests - [ ] Documentation
This makes basic view into the data possible. The sampling is too aggressive. In the future we'd like to handle selections on the full data set. Also, when zooming in...
Would it be possible to have no-regularization option for LR widget? Right now, it's not possible to test "pure" LR. Thank you in advance. 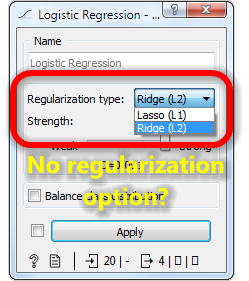 Env: Windows + Orange 3.31
**What's wrong?** **How can we reproduce the problem?** **What's your environment?** - Operating system: - Orange version: - How you installed Orange:
Hi, I just notice that Orange3 (the latest version at this time), recompute the `Test and Score` widget after applying any type of changes, even for insignificant change (things like...
**What's wrong?** ``` Traceback (most recent call last): File "/Users/vesna/pyqtgraph/pyqtgraph/graphicsItems/AxisItem.py", line 636, in paint specs = self.generateDrawSpecs(painter) File "/Users/vesna/pyqtgraph/pyqtgraph/graphicsItems/AxisItem.py", line 955, in generateDrawSpecs tickLevels = self.tickValues(self.range[0], self.range[1], lengthInPixels) File "/Users/vesna/orange3/Orange/widgets/visualize/owscatterplotgraph.py",...
**What's your use case?** Sometimes, one would like to convert several categorical variables to numeric (or vice-versa). This is not possible to do at the moment. One has to click...
**What's wrong?** Y axis in Distributions in some cases doesn't display max ticks. This makes it difficult to read the diagrams. **How can we reproduce the problem?** File (heart-disease) -...