orange3

orange3 copied to clipboard
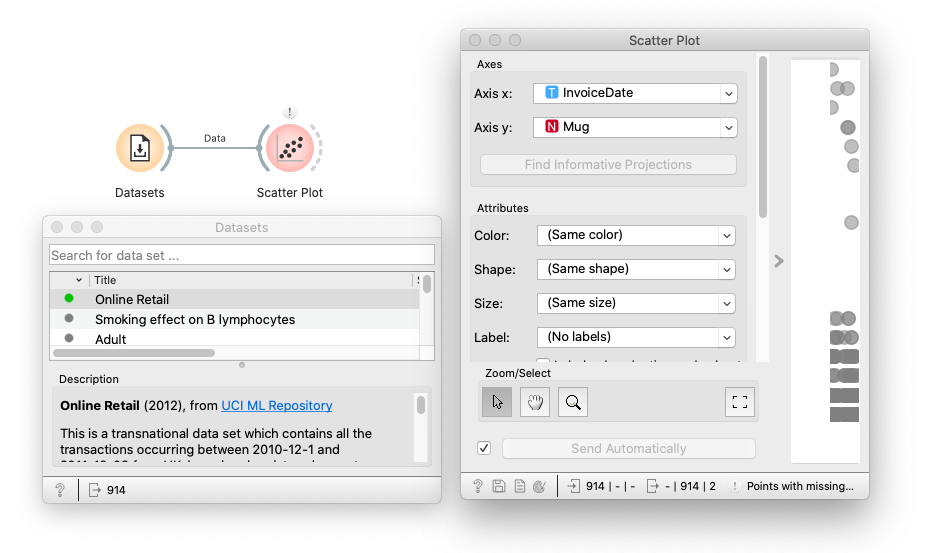
Scatter Plot: Crash with time data
What's wrong?
Traceback (most recent call last):
  File "/Users/vesna/pyqtgraph/pyqtgraph/graphicsItems/AxisItem.py", line 636, in paint
    specs = self.generateDrawSpecs(painter)
  File "/Users/vesna/pyqtgraph/pyqtgraph/graphicsItems/AxisItem.py", line 955, in generateDrawSpecs
    tickLevels = self.tickValues(self.range[0], self.range[1], lengthInPixels)
  File "/Users/vesna/orange3/Orange/widgets/visualize/owscatterplotgraph.py", line 354, in tickValues
    spacing = min(b - a for a, b in zip(ticks[:-1], ticks[1:]))
ValueError: min() arg is an empty sequence
How can we reproduce the problem?
Database (Online Retail) -> resize the ScatterPlot widget to the minimum width -> ScatterPlot (set x axis to InvoiceDate) -> crash