echarts
 echarts copied to clipboard
Apache ECharts is a powerful, interactive charting and data visualization library for browser

### Version 5.5.1 ### Link to Minimal Reproduction 无 ### Steps to Reproduce I encountered an issue while trying to align the axes of a histogram and a scatter plot....
### What problem does this feature solve? to implement this style, use renderItem to get points for each stacked series, the point from `api.coord([xValue, yIndex])` is the center of the...
### Version 5.5.1 ### Link to Minimal Reproduction https://echarts.apache.org/examples/zh/editor.html?code=PYBwLglsB2AEC8sDeAoWtJgDYFMBcya6GOAHmAQOQBKOAZjgE5OzB2wCGsA6jgEYBnCGByUANEXQCArnxHkqAMQ4BrHLAAiHMB3GTYuOhViUAxjmgjGlIgF8J6MMGBZIIAqmIZGEAOa-mKmEcAFsbdHsiXADoABMPfWAfC2NKADcmSFMOLD0vQ1SC8NhIqSYIHAECAG19Ty9YaA4Q_BMAQVNzAQFYRUZgMIcGsABPEFbKEAq8hsYOWIhpKpMAVgAGAFIZr1jtDhr9LyRYNJzpVoA2MUbmiYBlHA5GUwALWABRaF8IaFESoYayBOZ1aK2uTRaVA0EGYpjAlH-h2Ix1OWHOBAAjGtwbcqO8QhwILlEYD0CiQZiwTdISYAKrQKBwNqxAQI0qk8lo1rY6kTABqEFiOGAsGZrJKSIAugDiKEQC8OEJlvVAcEQndRrgEqTiAIFbFgAB3ABCaMYmOxSK8evmRoA8nQ6AIcGAABoES06qT6o0AYRcSSojF8fA4AAoeZHrmsAHQrACUxUBtiR7K8IR-bS-WtgWLW-hT6ElKFsAG4gA ### Steps to Reproduce 1. Set a relatively large pie.minAngle. 2. The values corresponding to each sector should not be similar....
## Brief Information This pull request is in the type of: - [ ] bug fixing - [x] new feature - [ ] others ### What does this PR do?...
### What problem does this feature solve? Hers is a bar chart that needs to be divided into different categories based on a certain classification, each category is highlighted with...
## Brief Information This pull request is in the type of: - [ ] bug fixing - [x] new feature - [ ] others ### What does this PR do?...
### What problem does this feature solve? const requestData = () => { let option = { tooltip: { trigger: 'item', triggerOn: 'mousemove' }, series: [ { type: 'tree', id:...
### Version 5.5.1 ### Link to Minimal Reproduction https://echarts.apache.org/examples/zh/index.html#chart-type-map3D ### Steps to Reproduce 1, ```vue ``` 2, ```js import echarts from '@/libs/echarts-pack'; import cityExport from '@/assets/mapJson/cityExport.js'; import { getDefaultView }...
## Brief Information This pull request is in the type of: - [ ] bug fixing - [x] new feature - [ ] others ### What does this PR do?...
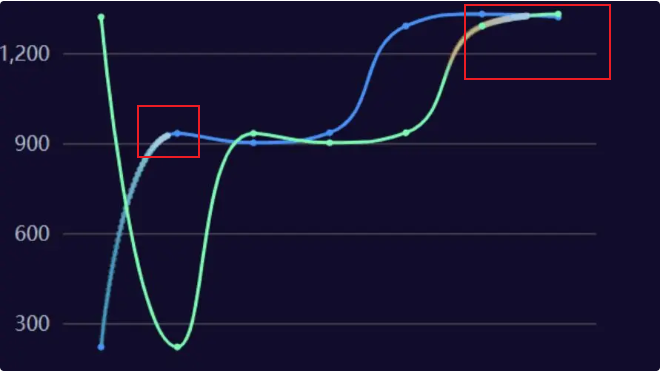
### What problem does this feature solve? vue introduced the broken line graph cannot achieve the flow effect of smooth attribute. ### What does the proposed API look like?