echarts
 echarts copied to clipboard
Apache ECharts is a powerful, interactive charting and data visualization library for browser

### Version 5.1.2 ### Steps to reproduce visualMap.pieces 分段太多的话,会造成放大缩小卡顿。分段越多越卡,大概是1200个分段会卡 ### What is expected? visualMap.pieces 分段太多的话,dataZoom 做优化,放大缩小不会卡顿 ### What is actually happening? dataZoom 放大缩小会卡 --- 我的需求是图表的每一段的颜色都不一样。 从第一个点开始,P0( 前一个点 ) 与 P1(...
``` option = { xAxis: { type: 'category', data: ['Mon', 'Tue', 'Wed', 'Thu', 'Fri', 'Sat', 'Sun'] }, yAxis: { type: 'log' }, series: [{ data: [0, 200, 150, 80, 70,...
### Version 5.4.3 ### Link to Minimal Reproduction https://echarts.apache.org/examples/zh/editor.html?c=bar-simple&renderer=svg&code=PYBwLglsB2AEC8sDeAoW7YCIDGwA2wATpgFywDaaG1mAxAKwCMAggGwCirmANFdenXYAOegBEAnADFMfWAF1eNMMHyQQpZLOoBnABbAA7mQBmAQzzaAprIC-ijJjyWA5pegATDan4OARsDBlAFsNAAZ7H0wIXGgNTEJgAFcPACVLbDAeLQcIMEsggHUIdzBdDUYAFgj-KLyggAlLCGddTLJK6ppc_IBxU3UyACYq22rMZ0Jir2yBZQHYcJmsf0DgELIAZkWfASdjNthGQc6HSZaD4ZOBGLBTCGgAGVNfSzwNMEJE62o7WUwAD2Y_wg2mmOywYAAniBLHEAG7mL5ZH5jSFAkFgnaYKEwuLYUx5ZxESHIrHuAmmDSUcE0QCeGYA7t0YpJpWAZg2Z_Dkoz-VkmllBZGpO28LKw0FMQVhZEwgHBjQDgFoxFUqmVcajipctTMRVTRtLdsABrOLKW5vHUOPDPV6Y0UOPSGDRmCzfUW_W2YXxaoolMrtVjmgTk25UpbgkW2yLiyVxBkq0OizAIvBIsihAB09AA7KF6PGfG6I-hw4WHFGNZg2RyS1gkymFmmKkI8_wbM2ueCCz5i-DMGW4vL2QGIdDy57tc3MHrTIbjQFzFWsZaXm8yN2E_aDI7zFZm52aR6vcVSuV_ROg5TBc3qGvC72JeXYwvb7WNemKoNxLnq3vbTeI3fo2lSshx7F8wgzQYrwwVtbXbHYYIwLkbCAA ### Steps to Reproduce option = { "color": [ "#51A6E6", "#E85D9F" ], "tooltip": { show: false }, "legend": { "bottom": 0,...
## Brief Information This pull request is in the type of: - [x] bug fixing - [ ] new feature - [ ] others ### What does this PR do?...
### Version 5.3.0 ### Link to Minimal Reproduction _No response_ ### Steps to Reproduce 1. Candlestick chart width `barMaxWidth`  2. set `barWidth: '80%'`, `barMaxWidth` not work  ### Current...
The logarithm of negative values is not defined. However, in the case of a logarithmic chart axis, it makes sense to define log(-x) as -log(x), to support logarithmic axes with...
### Version 5.3.0 ### Link to Minimal Reproduction _No response_ ### Steps to Reproduce https://echarts.apache.org/en/api.html#echartsInstance.getDataURL 中echartsInstance.getDataURL方法 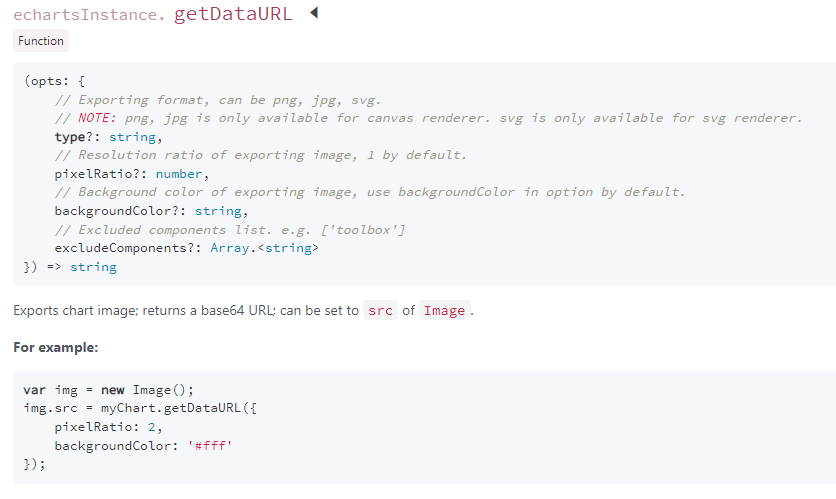 `var img = new Image(); img.src = myChart.getDataURL({ type:'svg' });` 返回的是UrlEncode而非是Base64 `data:image/svg+xml;charset=UTF-8,%3Csvg%20widt` ###...
### Version 5.3.0 ### Link to Minimal Reproduction _No response_ ### Steps to Reproduce 1. use sample pie chart. 2. change all value to negative. ### Current Behavior  ###...
### Version 5.3.0 ### Link to Minimal Reproduction https://codesandbox.io/s/fast-sun-4guwo?file=/src/index.js ### Steps to Reproduce 动态排序时,bar上升一位后标签会卡住 ### Current Behavior 动态排序时,bar上升一位后标签会卡住 ### Expected Behavior 排序后标签显示在相应位置 ### Environment ```markdown - OS: - Browser: -...
### Version 5.2.2 ### Link to Minimal Reproduction _No response_ ### Steps to Reproduce import ecStat from "echarts-stat"; echarts.registerTransform(ecStat.transform.regression); ### Current Behavior ts提示 类型“typeof EChartsStat”上不存在属性“transform” ### Expected Behavior 希望和echarts-stat沟通,加上typescript的“transform”属性 ###...