折线图设置 visualMap.pieces 2000个分段。配置dataZoom 放大缩小会卡,有什么方法解决吗?
Version
5.1.2
Steps to reproduce
visualMap.pieces 分段太多的话,会造成放大缩小卡顿。分段越多越卡,大概是1200个分段会卡
What is expected?
visualMap.pieces 分段太多的话,dataZoom 做优化,放大缩小不会卡顿
What is actually happening?
dataZoom 放大缩小会卡
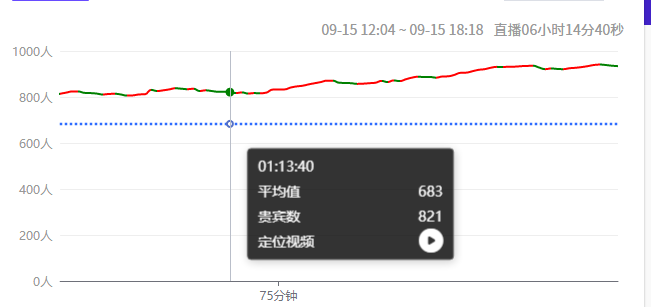
我的需求是图表的每一段的颜色都不一样。 从第一个点开始,P0( 前一个点 ) 与 P1( 后一点 ) 做比较, P1 > P0 红, P1 < P0 绿, P1 = P0 按P0 点颜色
除了visualMap.pieces 还有其他实现方案吗?
Hi! We've received your issue and please be patient to get responded. 🎉 The average response time is expected to be within one day for weekdays.
In the meanwhile, please make sure that it contains a minimum reproducible demo and necessary images to illustrate. Otherwise, our committers will ask you to do so.
A minimum reproducible demo should contain as little data and components as possible but can still illustrate your problem. This is the best way for us to reproduce it and solve the problem faster.
You may also check out the API and chart option to get the answer.
If you don't get helped for a long time (over a week) or have an urgent question to ask, you may also send an email to [email protected]. Please attach the issue link if it's a technical question.
If you are interested in the project, you may also subscribe to our mailing list.
Have a nice day! 🍵
@webywz It seems you are not using English, I've helped translate the content automatically. To make your issue understood by more people, we'd like to suggest using English next time. 🤗
TRANSLATED
TITLE
Line chart settings visualMap.pieces 2000 segments. Is there any solution to configure dataZoom to zoom in and out?
BODY
Version
5.1.2
Steps to reproduce
If visualMap.pieces has too many segments, it will cause zooming in and out. The more segments, the more cards, about 1200 segment meeting cards
What is expected?
If visualMap.pieces has too many segments, dataZoom will be optimized so that zooming in and out will not freeze
What is actually happening?
dataZoom zoom in and out the meeting card
My requirement is that the color of each segment of the chart is different. Starting from the first point, P0 (the previous point) is compared with P1 (the next point), P1> P0 red, P1 <P0 green, P1 = P0 Press P0 to point the color
Is there any other solution besides visualMap.pieces?
@webywz Please provide a minimum reproducible demo for the issue either with https://codepen.io/Ovilia/pen/dyYWXWM , https://www.makeapie.com/editor.html or https://codesandbox.io/s/mystifying-bash-2uthz.
A minimum reproducible demo should contain as little data and components as possible but can still illustrate your problem. This is the best way for us to reproduce it and solve the problem faster.
@pissang 我有尝试分成两个系列,但当数据点太多时,因为采样的关系,最终图形会有所变化。
@webywz 如果只有红绿两个颜色,建议分成两个系列,绿色系列中的红色数据部分用
'-'填充,同理红色系列
This issue has been automatically marked as stale because it did not have recent activity. It will be closed in 7 days if no further activity occurs. If you wish not to mark it as stale, please leave a comment in this issue.
This issue has been automatically closed because it did not have recent activity. If this remains to be a problem with the latest version of Apache ECharts, please open a new issue and link this to it. Thanks!