echarts
 echarts copied to clipboard
Apache ECharts is a powerful, interactive charting and data visualization library for browser

### Version 4.8.0 ### Reproduction link [https://codepen.io/wogaozhixu/pen/yLJEaZb](https://codepen.io/wogaozhixu/pen/yLJEaZb) ### Steps to reproduce The graphic property does not appear to be in effect ### What is expected? make it work! ### What...
### One-line summary [问题简述] GeometryCollection is a type of feature that should be accepted in the geojson format. But in echarts it creates an error: > Invalid geoJson format Cannot...
### Version 4.2.1 ### Link to Minimal Reproduction https://codesandbox.io/s/47s59 ### Steps to Reproduce 1. Drag or minimize the resolution. 2. The legends present on the right side are overlapping on...
### Version 4.9.0 ### Reproduction link [https://codepen.io/ChrisMash/pen/ExgXZLv](https://codepen.io/ChrisMash/pen/ExgXZLv) ### Steps to reproduce Centering labels on second and third xAxis cannot be done in an intuitive manner when the number of items...
### What problem does this feature solve? In case of large no. of values on y axis, the gap between axis ticks reduce. Because of this the axis label names...
### Version 5.3.0 ### Link to Minimal Reproduction https://codepen.io/Harshitha19/pen/wvmgbeZ ### Steps to Reproduce 1. Open the sample and click on any one of the legends to toggle the series line....
### Version 5.3.0 ### Link to Minimal Reproduction https://codepen.io/Harshitha19/pen/RwMRxEd ### Steps to Reproduce 1. Create a scatter series with different symbols, symbolRotation, and enable legends. 2. Observe that series symbol...
### Version 5.3.0 ### Link to Minimal Reproduction https://codepen.io/Harshitha19/pen/NWwZNWw ### Steps to Reproduce Create a chart with numeric category values. Observe that the chart is not rendering properly. Please look...
### What problem does this feature solve? option = { title: { text: 'Basic Radar Chart' }, legend: { data: ['Allocated Budget', 'Actual Spending'] }, radar: { // shape: 'circle',...
### Version 4.8.0 ### Reproduction link [https://gallery.echartsjs.com/editor.html?c=xnbEV04gQb&v=4](https://gallery.echartsjs.com/editor.html?c=xnbEV04gQb&v=4) ### Steps to reproduce 1、点击grid1中的热力图其中一部分; 2、grid0中的对应折线图区域,显示阴影部分; ### What is expected? 比如,当我点击热力图中的【1,2016】方块的时候,对应上方折线图时,我希望折线图中,出现宽度跟此方块宽度相同(也就是阴影部分宽度的起点与终点跟热力图中的点击的方块一致),高度拉满(对应折线图中0-100)的阴影图形;当我点击热力图中的【3,2018】时,之前的阴影消失,出现新的阴影部分,宽度依然跟当前的点击的方块保持一致(起点终点相同,并非0开始),高度也是同上,拉满(0-100)  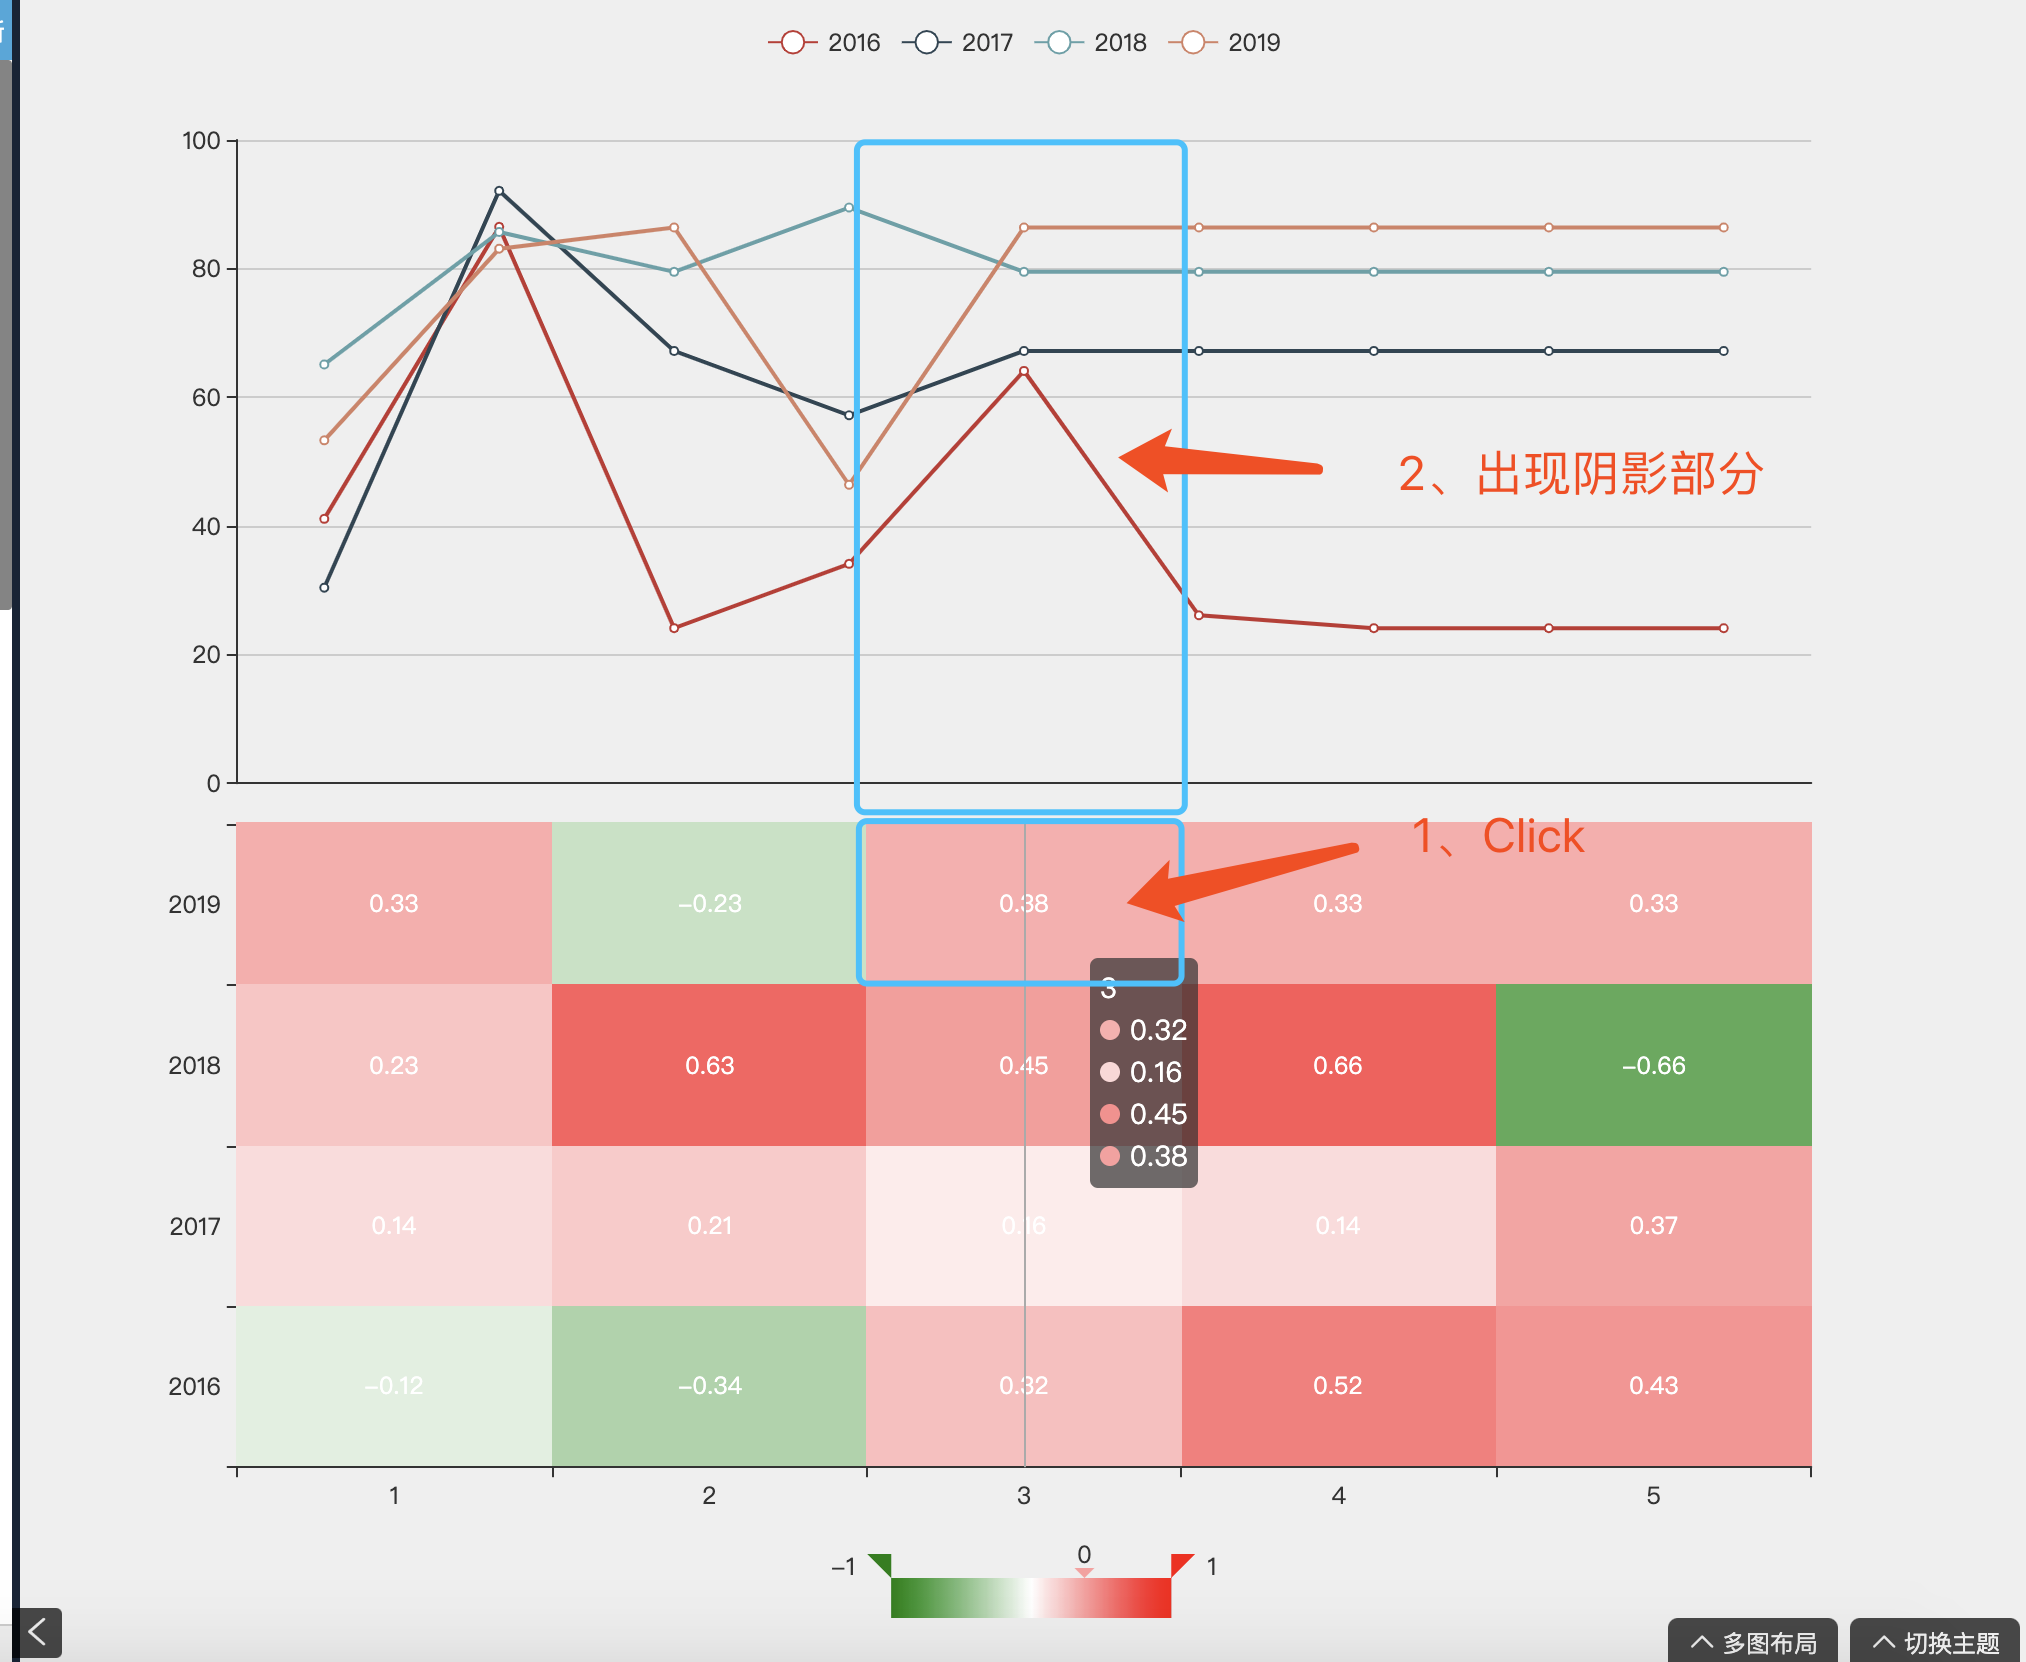 ### What is actually happening? 目前尚未实现 谢谢!