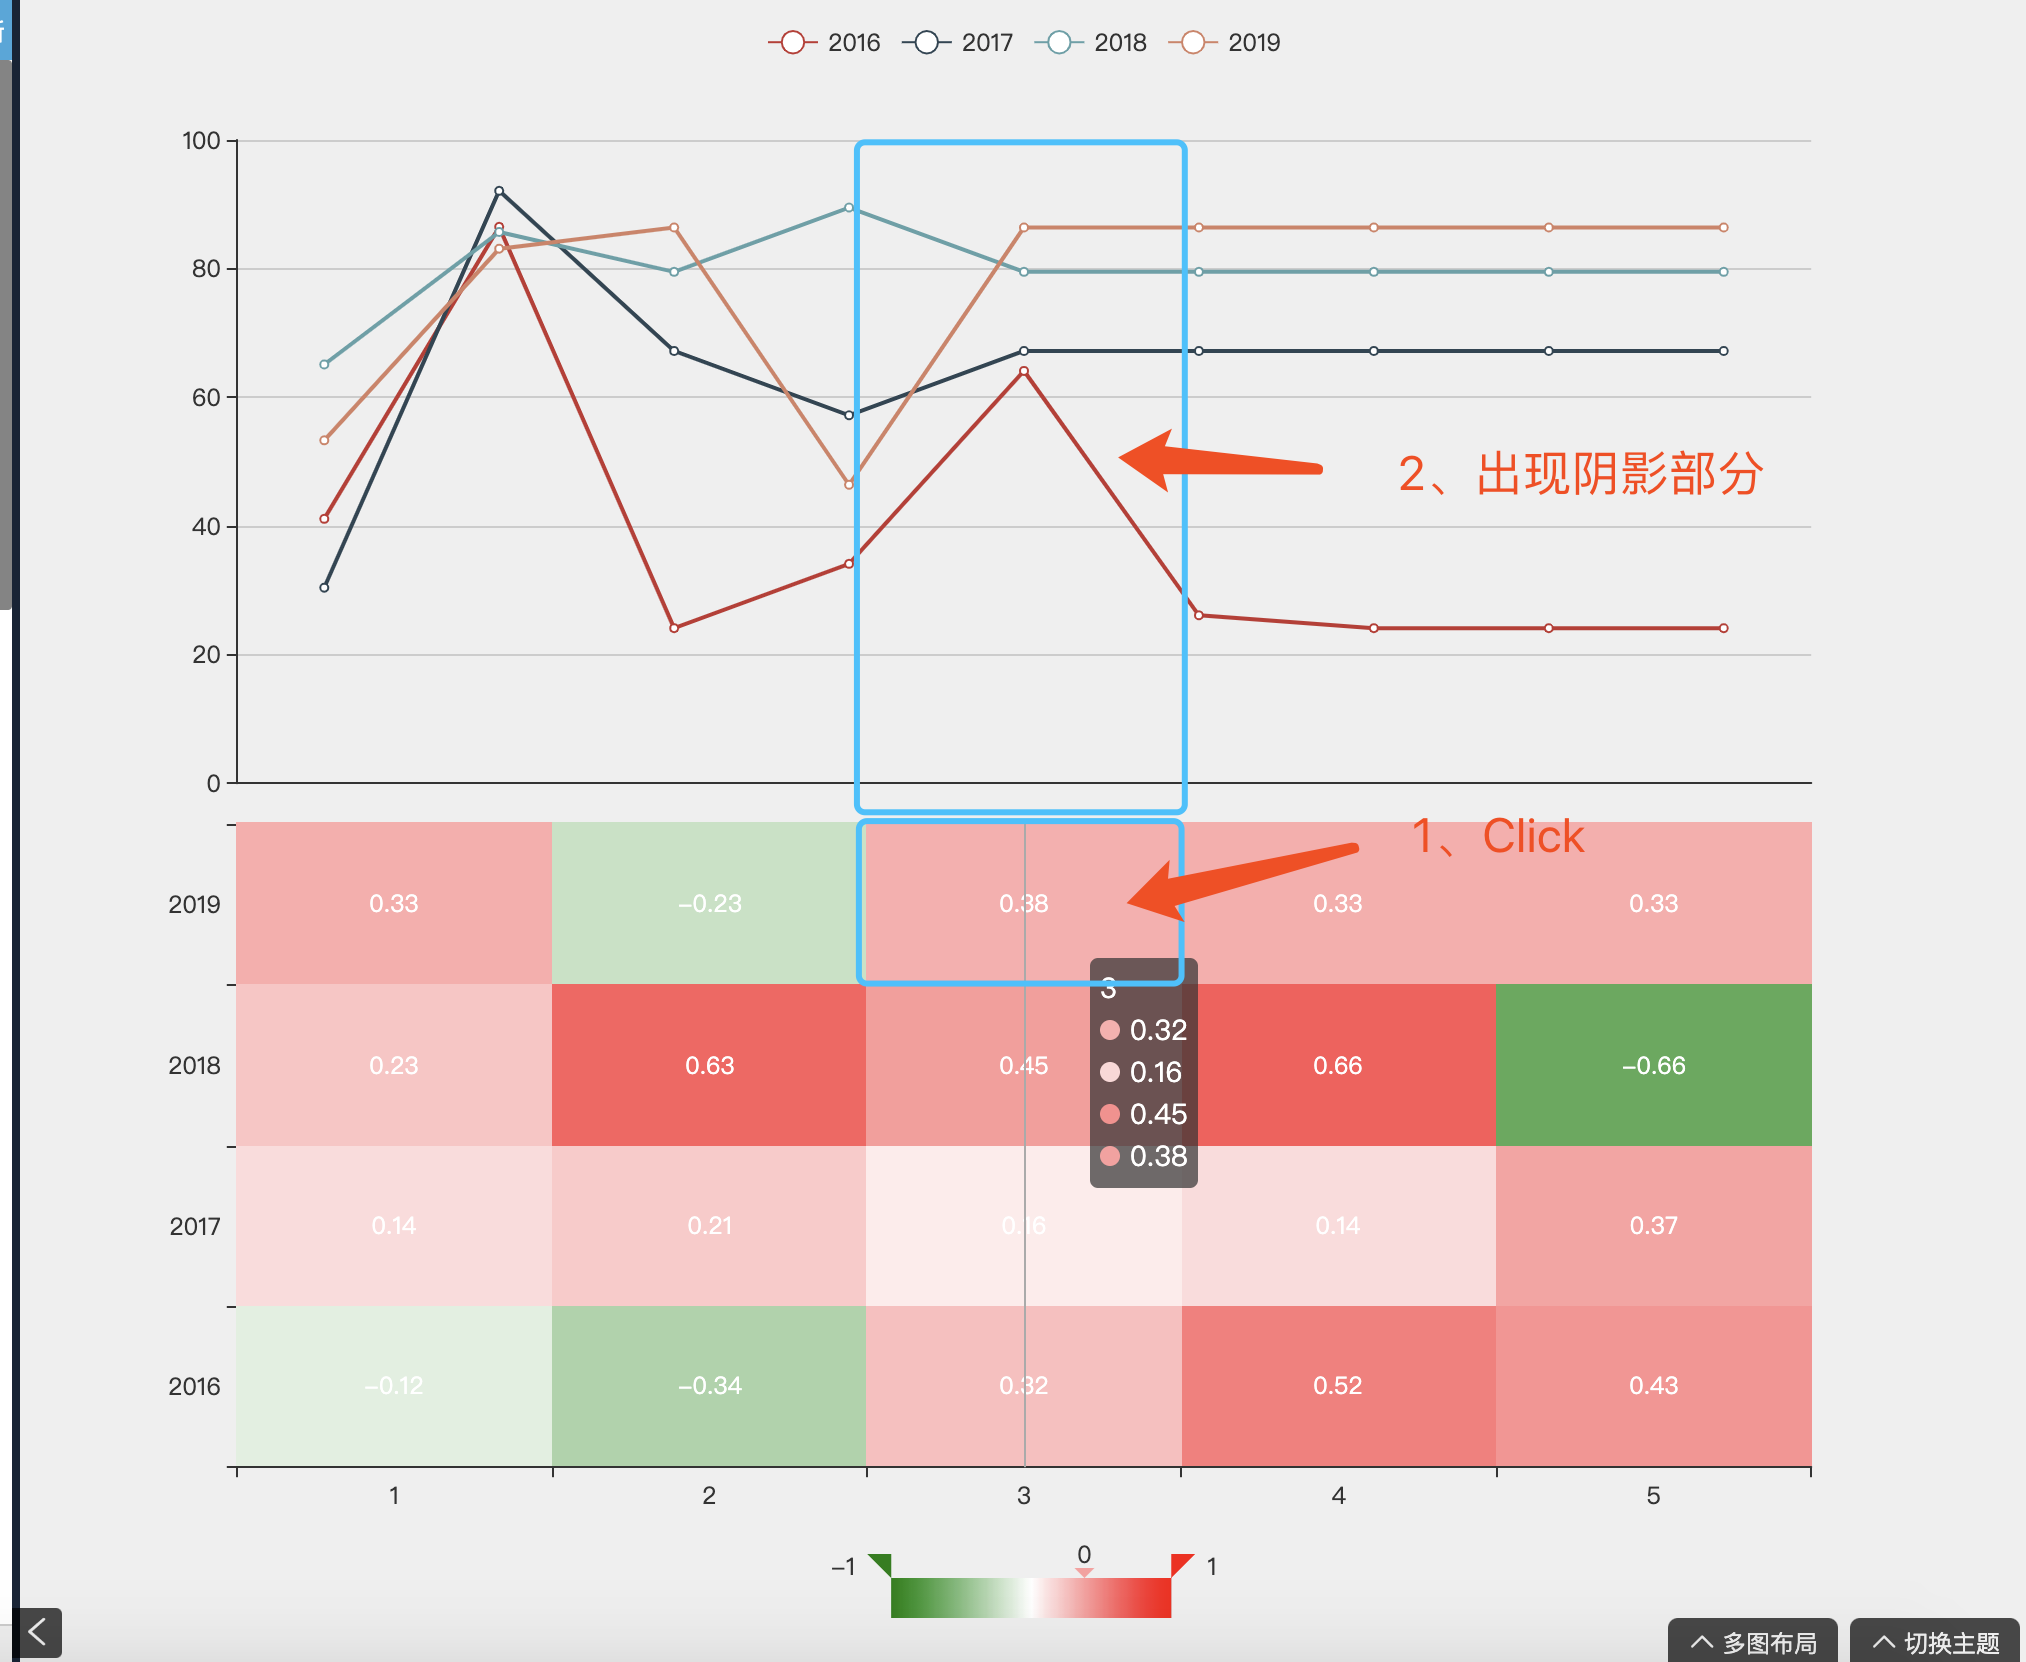
点击热力图某区域,给上方对应图形添加阴影部分
Version
4.8.0
Reproduction link
https://gallery.echartsjs.com/editor.html?c=xnbEV04gQb&v=4
Steps to reproduce
1、点击grid1中的热力图其中一部分; 2、grid0中的对应折线图区域,显示阴影部分;
What is expected?
比如,当我点击热力图中的【1,2016】方块的时候,对应上方折线图时,我希望折线图中,出现宽度跟此方块宽度相同(也就是阴影部分宽度的起点与终点跟热力图中的点击的方块一致),高度拉满(对应折线图中0-100)的阴影图形;当我点击热力图中的【3,2018】时,之前的阴影消失,出现新的阴影部分,宽度依然跟当前的点击的方块保持一致(起点终点相同,并非0开始),高度也是同上,拉满(0-100)

What is actually happening?
目前尚未实现
谢谢!
Hi! We've received your issue and please be patient to get responded. 🎉 The average response time is expected to be within one day for weekdays.
In the meanwhile, please make sure that you have posted enough image to demo your request. You may also check out the API and chart option to get the answer.
If you don't get helped for a long time (over a week) or have an urgent question to ask, you may also send an email to [email protected]. Please attach the issue link if it's a technical questions.
If you are interested in the project, you may also subscribe our mail list.
Have a nice day! 🍵
This issue has been automatically marked as stale because it did not have recent activity. It will be closed in 7 days if no further activity occurs. If you wish not to mark it as stale, please leave a comment in this issue.