scopy
 scopy copied to clipboard
A software oscilloscope and signal analysis toolset
Hi: Here is a possible enhancement to the M2K/Scopy functionality. Would it be possible to add the capability to use the User power supply DACs as slow AWG outputs? Probably...

Item 16 from Issue #4 "Need a few more math functions like random, sinc ( sin(x)/x ) …."
Connect M2K. Start Scopy, select the detected device. Press "Connect" button. After the connection is made, select Oscilloscope feature. A "Track Waveform" feature should be added, that manages the horizontal...
I've noticed something about how the M2K gets calibrated by Scopy. The first time Scopy is run after an M2K boots up ( freshly turned on ) the AWG output...
This topic is opened based on the discussion regarding the maximum supported input voltage. (See #83 )
I think it will be a good idea to add the Abs() function, reedit the math plot function, display it on the plot window as a label and maybe add...
Implement FFT window plot. Should the FFT instrument from the oscilloscope use the same settings as the spectrum analyzer or we should have a different set of settings ? Which...
Scopy version: e9a6c85 For Uniform Noise Type, currently the amplitude is implemented as peak value.  Shouldn't it represent the peak-peak value?
I think that is more intuitive to have the selected marker yellow filled. See pic (M2 is selected, M1 is yellow filled). 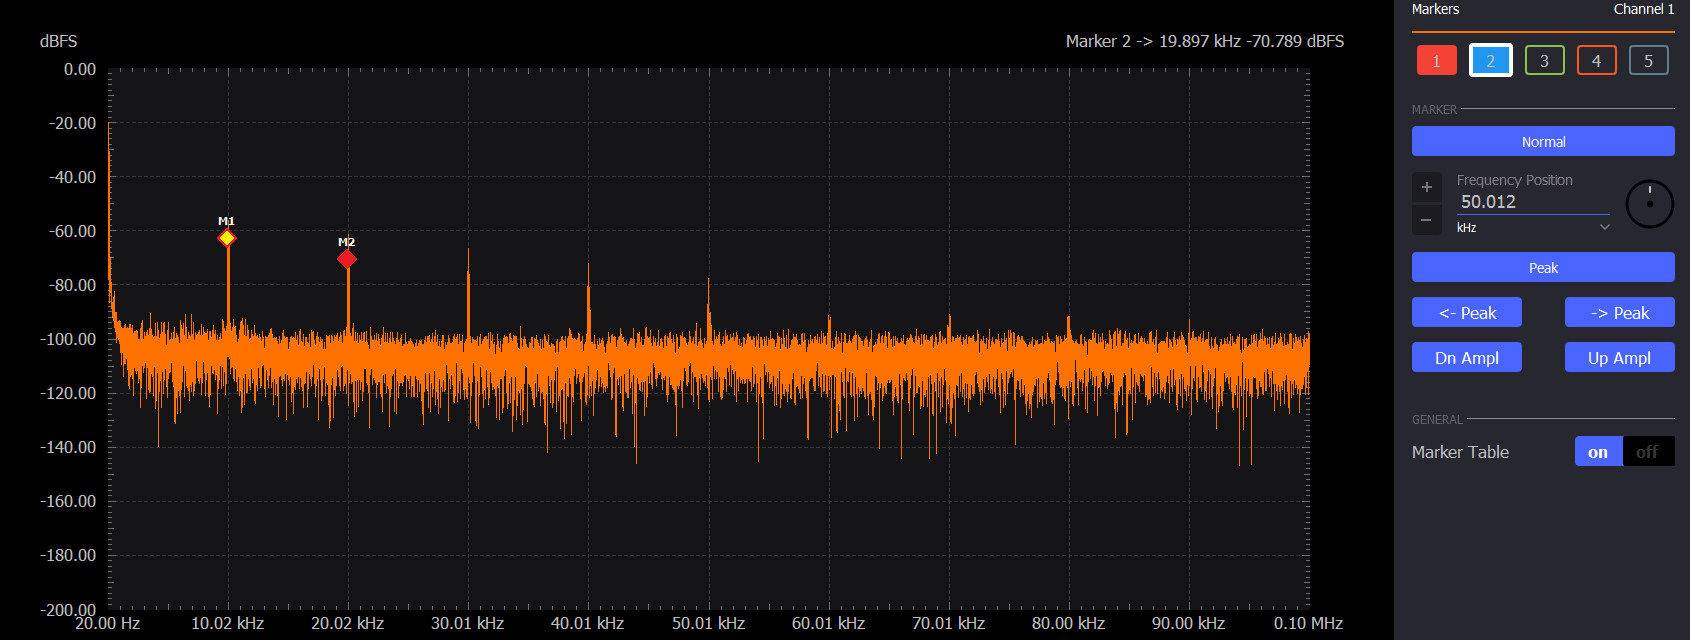
There are ways to export png in the instruments, but sometimes - it's the time variation that is more important for documentation/labs. In this case - export to animation would...
Metadata
Owner
Metadata
A software oscilloscope and signal analysis toolset