Vivian Si
Vivian Si
Bug is repro on https://df.security.microsoft.com/securityreports?tid=596ade3a-1abe-4c5b-b7d5-a169c4b05d4a, 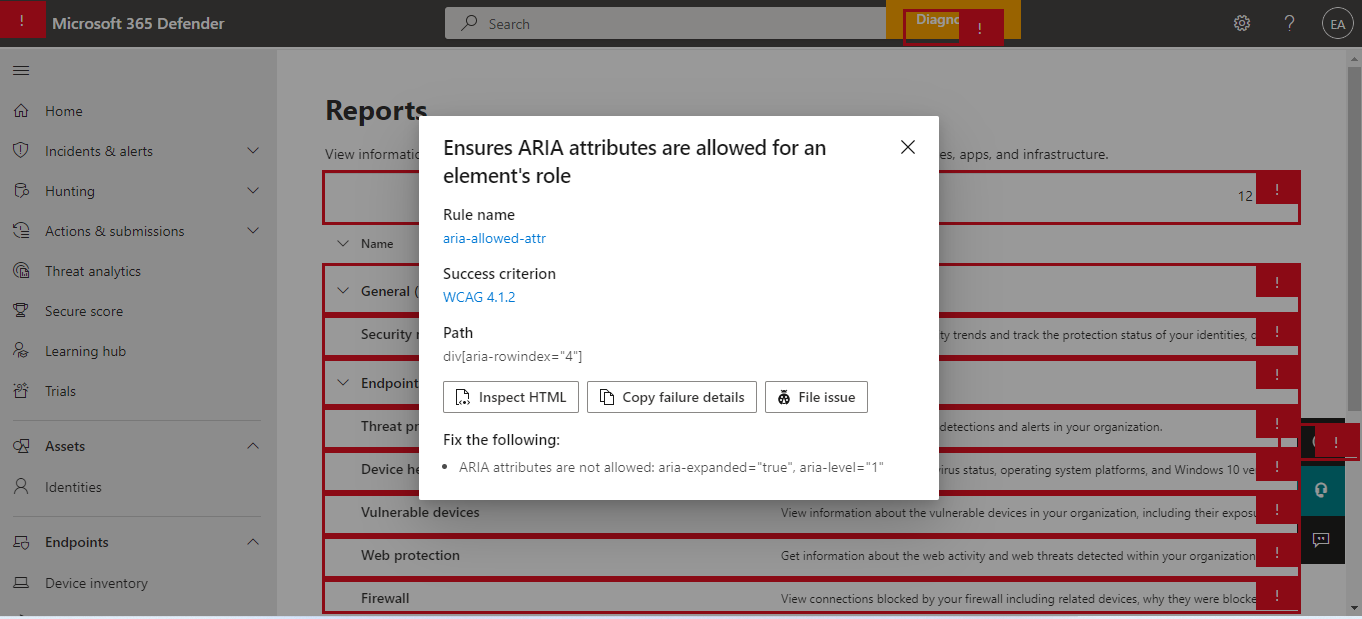
Bug is repro on bar chart(please see image from link below), pie chart(https://github.com/highcharts/highcharts/issues/15040), area chart(https://github.com/highcharts/highcharts/issues/15921) 
@oysteinmoseng When I load high chart page, for example [highchartsbar](https://www.highcharts.com/demo/bar-basic), it displays well. Then I turn on high contrast black/white, the bar chart keeps the colorful state in the beginning(I...
@oysteinmoseng Do you have some workaround for this bug? I received similar bugs which caused by this bug, so leave this message to highlight.
When I open https://jsfiddle.net/BlackLabel/52jvpuo9/ and then apply contrast theme Aquatic, please see screenshot about actual result. We got another bug which reported on Win11 OS about 4 new contrast themes,...
We find a bug which repro on [M365-SCC Page Templates ⋅ subcomponents/CommandBarItem/DropdownControl - Default (scc-storybook.azurewebsites.net)](https://scc-storybook.azurewebsites.net/?path=/story/subcomponents-commandbaritem-dropdowncontrol--default). When open NVDA speech viewer, expanded displays on speech viewer when activate drop down control....
This bug is repro on https://www.highcharts.com/demo/area-negative. Low vision users will be impacted as graph line color are not visible in properly high contrast Aquatic/Desert mode. Could you please help to...
> @VivianSi233 The lines in the screenshot above look correct to me. Do I understand correctly that you would prefer to override the high contrast white with your own colors...
@oysteinmoseng Based on your comments (please see screenshot below), I find legends from https://www.highcharts.com/demo/highcharts/line-chart have different shapes. So is it possible that legends from column chart have the same design...
@oysteinmoseng We find the **tooltip** can help users to get info from chart, it is not color alone to identify the column bars, right? Maybe don't need to add shapes...