Whale Fall
![]()
![]()
![]()
Whale Fall
> 你好,请问,你这例子是怎么运行起来的啊。我用docker安装的环境,按照介绍运行,结果出现了[issue 230](https://github.com/PaddlePaddle/PaddleFL/issues/230) 的情况。能说说你是怎么运行起来的嘛? 我没用docker 直接linux装的conda环境
> > > 您好,您的问题我已经复现,正在由内部相关同事帮您排插问题。有最新进展会尽快给您答复! 好的 非常感谢!
> > > 您好,跟paddle的同学请教了下,因为当前profiler的设计是统计计算Kernel的时间。recv OP是用来通讯的,里面没有实际的运行kernel,所以当前是不会显示在profiler里面的。 您好,请问trainer中的sendprogram和recvprogram是在内核中进行吗,我发现profile记录了trainer端的通讯过程
> > > 请问在训练的时候,添加了下面的环境变量么? > > ``` > FLAGS_rpc_server_profile_period=10 FLAGS_rpc_server_profile_path=./tmp/pserver > ``` 您好 我已经添加了 不过为了方便,我生成的profile都放在了代码运行的路径上。目前因为个人水平原因对paddlefl的通信框架还不太了解,请问采用的是gRPC的架构吗
> > > 是采用的grpc框架,相应的op是在Paddle主框架中实现的:https://github.com/PaddlePaddle/Paddle/blob/release/1.8/paddle/fluid/operators/distributed_ops/fl_listen_and_serv_op.cc 好的 非常感谢!顺便请教您,请问我想获取这段op的时间分布,可以采用什么方法呢?
> > > https://github.com/PaddlePaddle/Paddle/blob/release/1.8/paddle/fluid/operators/distributed_ops/fl_listen_and_serv_op.cc#L164 这里有给相应的log信息,可以尝试在跑server的机器运行下面指令: > > ``` > export GLOG_V=3 > ``` 您好,实在不好意思,我按照您的系列建议重新改写了shell, 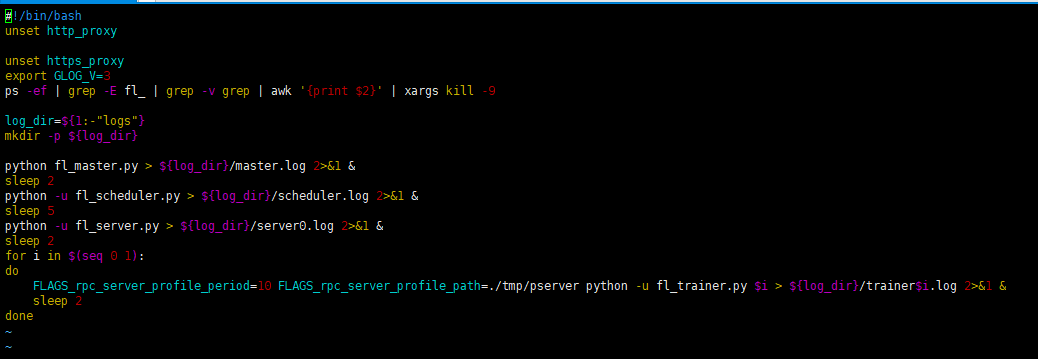 但最后似乎server日志中只生成了sum和scale的打印结果,请问是不是我对GLOG的使用有误导致没有输出? 
> Grpc is used only in the horizontal learning mode. In the MPC mode, we do not use Grpc. Instead, we use gloo as communication infra. 您好,感谢回复!我这边跑的就是横向联邦学习,跑的是/paddlefl/example里的demo
你好 paddlefl需要用python2吗,我这两天一直用python3跑不起来。。
> > > For now Paddle FL runs on only PaddlePaddle 1.8.0. Supporting PaddlePaddle 2.0 is on our near plan, FYI. OK,I have achieved on 1.8.0 . thx
> > > > > For now Paddle FL runs on only PaddlePaddle 1.8.0. Supporting PaddlePaddle 2.0 is on our near plan, FYI. > > > > > > OK,I...