maftools
 maftools copied to clipboard
plotMafSummary error: error in setattr(x,"row.names",rn)
Hi,
When I used plotMafSummary, I got error like this:
plotmafSummary(maf=maf, rmOutlier = TRUE, addStat='median', dashboard = T, titvRaw = FALSE) Error in setattr(x, "row.names", rn) : row names must be 'character' or 'integer', not 'integer'
My maf file is composed of SNV/Indel file and CNV file I manually generated. (It is composed of three columns: gene, sampleID, CNVstatus)
How can I fix it?
Best, Soojin
Hi,
Could you post your sessionInfo ? Also how many samples do you have in your maf ?
Hi,
- There are over 3,000 samples in my maf.
- My sessionInfo is:
function (package = NULL)
{
    z <- list()
    z$R.version <- R.Version()
    z$platform <- z$R.version$platform
    if (nzchar(.Platform$r_arch))
        z$platform <- paste(z$platform, .Platform$r_arch, sep = "/")
    z$platform <- paste0(z$platform, " (", 8 * .Machine$sizeof.pointer,
        "-bit)")
    z$locale <- Sys.getlocale()
    if (.Platform$OS.type == "windows") {
        z$running <- win.version()
    }
    else if (nzchar(Sys.which("uname"))) {
        uname <- system("uname -a", intern = TRUE)
        os <- sub(" .*", "", uname)
        z$running <- switch(os, Linux = if (file.exists("/etc/os-release")) {
            tmp <- readLines("/etc/os-release")
            t2 <- if (any(startsWith(tmp, "PRETTY_NAME="))) sub("^PRETTY_NAME=",
                "", grep("^PRETTY_NAME=", tmp, value = TRUE)[1L]) else if (any(startsWith(tmp,
                "NAME"))) sub("^NAME=", "", grep("^NAME=", tmp,
                value = TRUE)[1L]) else "Linux (unknown distro)"
            sub("\"(.*)\"", "\\1", t2)
        } else if (file.exists("/etc/system-release")) {
            readLines("/etc/system-release")
        }, Darwin = {
            ver <- readLines("/System/Library/CoreServices/SystemVersion.plist")
            ind <- grep("ProductUserVisibleVersion", ver)
            ver <- ver[ind + 1L]
            ver <- sub(".*<string>", "", ver)
            ver <- sub("</string>$", "", ver)
            ver1 <- strsplit(ver, ".", fixed = TRUE)[[1L]][2L]
            sprintf("%s %s %s", ifelse(as.numeric(ver1) < 12,
                "OS X", "macOS"), switch(ver1, `6` = "Snow Leopard",
                `7` = "Lion", `8` = "Mountain Lion", `9` = "Mavericks",
                `10` = "Yosemite", `11` = "El Capitan", `12` = "Sierra",
                `13` = "High Sierra", ""), ver)
        }, SunOS = {
            ver <- system("uname -r", intern = TRUE)
            paste("Solaris", strsplit(ver, ".", fixed = TRUE)[[1L]][2L])
        }, uname)
    }
    if (is.null(package)) {
        package <- grep("^package:", search(), value = TRUE)
        keep <- vapply(package, function(x) x == "package:base" ||
            !is.null(attr(as.environment(x), "path")), NA)
        package <- .rmpkg(package[keep])
    }
    pkgDesc <- lapply(package, packageDescription, encoding = NA)
    if (length(package) == 0)
        stop("no valid packages were specified")
    basePkgs <- sapply(pkgDesc, function(x) !is.null(x$Priority) &&
        x$Priority == "base")
    z$basePkgs <- package[basePkgs]
    if (any(!basePkgs)) {
        z$otherPkgs <- pkgDesc[!basePkgs]
        names(z$otherPkgs) <- package[!basePkgs]
    }
    loadedOnly <- loadedNamespaces()
    loadedOnly <- loadedOnly[!(loadedOnly %in% package)]
    if (length(loadedOnly)) {
        names(loadedOnly) <- loadedOnly
        pkgDesc <- c(pkgDesc, lapply(loadedOnly, packageDescription))
        z$loadedOnly <- pkgDesc[loadedOnly]
    }
    z$matprod <- as.character(options("matprod"))
    es <- extSoftVersion()
    z$BLAS <- as.character(es["BLAS"])
    z$LAPACK <- La_library()
    class(z) <- "sessionInfo"
    z
}
<bytecode: 0x27172110>
<environment: namespace:utils>
The error was appeared when the last plot was creating.
Thanks.
I think there is an issue with the sessionInfo. You should run it as a function. Try to run sessionInfo() and post the output.
When I run sessionInfo(), the output is:
> sessionInfo()
R version 3.5.1 (2018-07-02)
Platform: x86_64-redhat-linux-gnu (64-bit)
Running under: CentOS Linux 7 (Core)

Matrix products: default
BLAS/LAPACK: /usr/lib64/R/lib/libRblas.so

locale:
 [1] LC_CTYPE=en_US.UTF-8       LC_NUMERIC=C               LC_TIME=en_US.UTF-8
 [4] LC_COLLATE=en_US.UTF-8     LC_MONETARY=en_US.UTF-8    LC_MESSAGES=en_US.UTF-8
 [7] LC_PAPER=en_US.UTF-8       LC_NAME=C                  LC_ADDRESS=C
[10] LC_TELEPHONE=C             LC_MEASUREMENT=en_US.UTF-8 LC_IDENTIFICATION=C

attached base packages:
[1] parallel  stats     graphics  grDevices utils     datasets  methods   base

other attached packages:
 [1] dplyr_0.8.0.1        survminer_0.4.3      ggpubr_0.2           magrittr_1.5         ggplot2_3.1.0
 [6] survival_2.43-3      maftools_1.8.0       Biobase_2.42.0       BiocGenerics_0.28.0  BiocManager_1.30.4
[11] BiocInstaller_1.32.1

loaded via a namespace (and not attached):
 [1] nlme_3.1-137                bitops_1.0-6                matrixStats_0.54.0
 [4] cmprsk_2.2-7                doParallel_1.0.14           RColorBrewer_1.1-2
 [7] GenomeInfoDb_1.18.1         tools_3.5.1                 backports_1.1.3
[10] R6_2.3.0                    lazyeval_0.2.1              colorspace_1.3-2
[13] GetoptLong_0.1.7            withr_2.1.2                 tidyselect_0.2.5
[16] gridExtra_2.3               compiler_3.5.1              DelayedArray_0.8.0
[19] pkgmaker_0.27               rtracklayer_1.42.1          scales_1.0.0
[22] survMisc_0.5.5              NMF_0.21.0                  stringr_1.3.1
[25] digest_0.6.18               Rsamtools_1.34.0            XVector_0.22.0
[28] pkgconfig_2.0.2             bibtex_0.4.2                BSgenome_1.50.0
[31] rlang_0.3.1                 GlobalOptions_0.1.0         rstudioapi_0.8
[34] shape_1.4.4                 generics_0.0.2              zoo_1.8-4
[37] mclust_5.4.2                BiocParallel_1.16.2         RCurl_1.95-4.11
[40] GenomeInfoDbData_1.2.0      wordcloud_2.6               Matrix_1.2-15
[43] Rcpp_1.0.0                  munsell_0.5.0               S4Vectors_0.20.1
[46] stringi_1.2.4               SummarizedExperiment_1.12.0 zlibbioc_1.28.0
[49] plyr_1.8.4                  grid_3.5.1                  ggrepel_0.8.0
[52] crayon_1.3.4                lattice_0.20-38             Biostrings_2.50.1
[55] cowplot_0.9.4               splines_3.5.1               circlize_0.4.5
[58] knitr_1.21                  ComplexHeatmap_1.20.0       pillar_1.3.1
[61] GenomicRanges_1.34.0        rjson_0.2.20                rngtools_1.3.1
[64] reshape2_1.4.3              codetools_0.2-16            stats4_3.5.1
[67] XML_3.98-1.16               glue_1.3.0                  data.table_1.12.0
[70] foreach_1.4.4               gtable_0.2.0                purrr_0.2.5
[73] tidyr_0.8.2                 km.ci_0.5-2                 assertthat_0.2.0
[76] xfun_0.5                    gridBase_0.4-7              xtable_1.8-3
[79] broom_0.5.1                 tibble_2.0.1                iterators_1.0.10
[82] GenomicAlignments_1.18.0    registry_0.5                IRanges_2.16.0
[85] KMsurv_0.1-5                cluster_2.0.7-1
Would it be possible for you to update the package and let me know if it fixes the issue ? If it doesn't, I will further take a look.
library("devtools")
install_github(repo = "PoisonAlien/maftools")
Also, can you post the output from getSampleSummary(maf) ? I think your sample names are integers rather than characters which might be causing the issue.
I did update as your comment, but it cannot fix the problem. Same error was occurred.
And I know the pattern of my tested sample's name that is not composed of only integers.
Anyway, I post the output from getSampleSummary(maf)
Tumor_Sample_Barcode Frame_Shift_Del Frame_Shift_Ins In_Frame_Del In_Frame_Ins
   1:  GENIE-DFCI-009401-9718               2               0            0            0
   2:                  AD3866               4               0            0            0
   3:                 AD15737               0               1            0            0
   4: GENIE-DFCI-035748-48547               5               2            1            0
   5:                  AD4516               3               0            1            0
  ---
3067:       P-0009901-T01-IM5               0               0            0            0
3068:       P-0010808-T01-IM5               0               0            0            0
3069:       P-0015856-T01-IM6               0               0            0            0
3070:       P-0016277-T01-IM6               0               0            0            0
3071:                PD11458a               0               0            0            0
      Missense_Mutation Nonsense_Mutation Nonstop_Mutation Splice_Site Translation_Start_Site
   1:                57                 8                0           1                      0
   2:                38                 5                0           2                      0
   3:                33                 3                0           1                      0
   4:                21                 2                1           3                      0
   5:                25                 4                0           2                      0
  ---
3067:                 0                 0                0           0                      0
3068:                 0                 0                0           0                      0
3069:                 0                 0                0           0                      0
3070:                 0                 0                0           0                      0
3071:                 0                 0                0           0                      0
      total Amp Del CNV_total
   1:    68  57  32        89
   2:    49   0   0         0
   3:    38   0   0         0
   4:    35  22  16        38
   5:    35   0   0         0
  ---
3067:     0   1   0         1
3068:     0   1   0         1
3069:     0   1   0         1
3070:     0   1   0         1
3071:     0   0   1         1
And the other functions of maftools shows no error. It works well.
Okay, I have hard time figuring the issue. Is it possible for you to provide me with a small reproducible example file ?
Sure. Before I give you an example file, I'd like to confirm one thing I noticed now. In maf file generated by read.maf(), are there two columns named of 'Tumor_Sample_Barcode' ? I found the columns are in 16th column (maybe original position in maf file) and also in the last column. And column in the last position doesn't have any sample's name. Is it the correct result of read.maf()?
Okay, it's possible that it might be causing conflicts. Did you try changing name of the last column with empty values or remove it if its not required?
-
Changing name of the last column is not related with the error because it did not affect to function:
plotMafSummary. -
I attached files which make the error. I hope it helps solving the issue. example.zip
-
Unfortunately, I found another error that I didn't see in yesterday. When I run
oncoplot, the percentage of altered genes shows over 100% as shown in below, and I cannot see the result since it is hided by border color.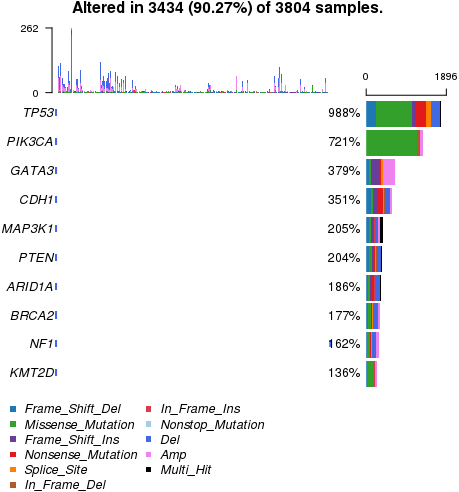 Yesterday, it did work well. Is there any problem between yesterday and today?
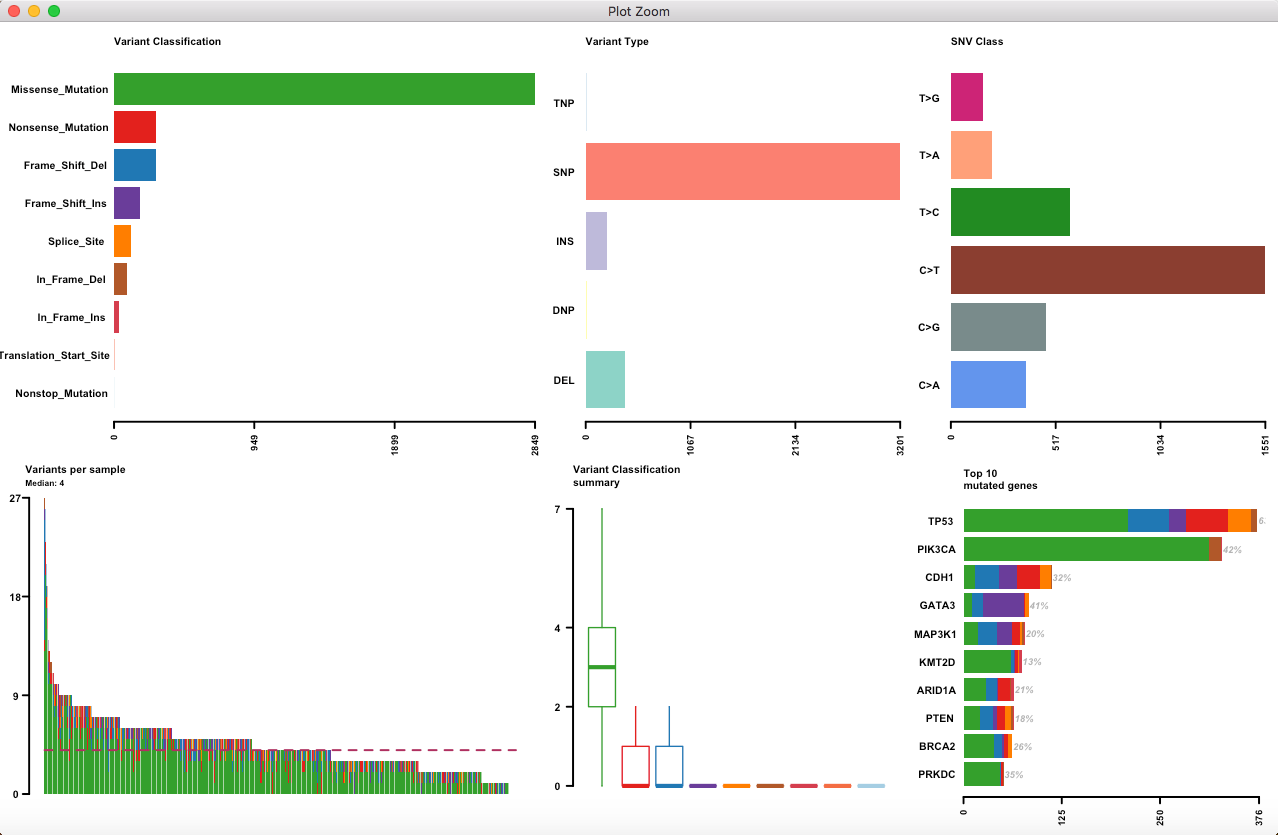
@scha36 The strange thing is I have no error when running plotmafSummary() function.
My computer just installed R and RStudio yesterday.
library(maftools)

maf = read.maf(maf = "~/Downloads/example/example_mut", clinicalData = "~/Downloads/example/example_clinical",
               cnTable = "~/Downloads/example/example_cnv")

plotmafSummary(maf)
> devtools::session_info()
─ Session info ──────────────────────────────────────────────────────────────────
 setting  value
 version  R version 3.5.2 (2018-12-20)
 os       macOS High Sierra 10.13.6
 system   x86_64, darwin15.6.0
 ui       RStudio
 language (EN)
 collate  zh_CN.UTF-8
 ctype    zh_CN.UTF-8
 tz       Asia/Shanghai
 date     2019-03-06

─ Packages ──────────────────────────────────────────────────────────────────────
 package              * version   date       lib source
 assertthat             0.2.0     2017-04-11 [1] CRAN (R 3.5.0)
 backports              1.1.3     2018-12-14 [1] CRAN (R 3.5.0)
 bibtex                 0.4.2     2017-06-30 [1] CRAN (R 3.5.0)
 Biobase              * 2.42.0    2018-10-30 [1] Bioconductor
 BiocGenerics         * 0.28.0    2018-10-30 [1] Bioconductor
 BiocParallel           1.16.6    2019-02-17 [1] Bioconductor
 Biostrings             2.50.2    2019-01-03 [1] Bioconductor
 bitops                 1.0-6     2013-08-17 [1] CRAN (R 3.5.0)
 BSgenome               1.50.0    2018-10-30 [1] Bioconductor
 callr                  3.1.1     2018-12-21 [1] CRAN (R 3.5.0)
 circlize               0.4.5     2018-11-21 [1] CRAN (R 3.5.0)
 cli                    1.0.1     2018-09-25 [1] CRAN (R 3.5.0)
 cluster                2.0.7-1   2018-04-13 [1] CRAN (R 3.5.2)
 codetools              0.2-16    2018-12-24 [1] CRAN (R 3.5.2)
 colorspace             1.4-0     2019-01-13 [1] CRAN (R 3.5.2)
 ComplexHeatmap         1.20.0    2018-10-30 [1] Bioconductor
 cowplot                0.9.4     2019-01-08 [1] CRAN (R 3.5.2)
 crayon                 1.3.4     2017-09-16 [1] CRAN (R 3.5.0)
 data.table             1.12.0    2019-01-13 [1] CRAN (R 3.5.2)
 DelayedArray           0.8.0     2018-10-30 [1] Bioconductor
 desc                   1.2.0     2018-05-01 [1] CRAN (R 3.5.0)
 devtools               2.0.1     2018-10-26 [1] CRAN (R 3.5.2)
 digest                 0.6.18    2018-10-10 [1] CRAN (R 3.5.0)
 doParallel             1.0.14    2018-09-24 [1] CRAN (R 3.5.0)
 dplyr                  0.8.0.1   2019-02-15 [1] CRAN (R 3.5.2)
 foreach                1.4.4     2017-12-12 [1] CRAN (R 3.5.0)
 fs                     1.2.6     2018-08-23 [1] CRAN (R 3.5.0)
 GenomeInfoDb           1.18.2    2019-02-12 [1] Bioconductor
 GenomeInfoDbData       1.2.0     2019-03-06 [1] Bioconductor
 GenomicAlignments      1.18.1    2019-01-04 [1] Bioconductor
 GenomicRanges          1.34.0    2018-10-30 [1] Bioconductor
 GetoptLong             0.1.7     2018-06-10 [1] CRAN (R 3.5.0)
 ggplot2                3.1.0     2018-10-25 [1] CRAN (R 3.5.0)
 ggrepel                0.8.0     2018-05-09 [1] CRAN (R 3.5.0)
 GlobalOptions          0.1.0     2018-06-09 [1] CRAN (R 3.5.0)
 glue                   1.3.0     2018-07-17 [1] CRAN (R 3.5.0)
 gridBase               0.4-7     2014-02-24 [1] CRAN (R 3.5.0)
 gridExtra              2.3       2017-09-09 [1] CRAN (R 3.5.0)
 gtable                 0.2.0     2016-02-26 [1] CRAN (R 3.5.0)
 IRanges                2.16.0    2018-10-30 [1] Bioconductor
 iterators              1.0.10    2018-07-13 [1] CRAN (R 3.5.0)
 lattice                0.20-38   2018-11-04 [1] CRAN (R 3.5.2)
 lazyeval               0.2.1     2017-10-29 [1] CRAN (R 3.5.0)
 maftools             * 1.8.0     2018-10-30 [1] Bioconductor
 magrittr               1.5       2014-11-22 [1] CRAN (R 3.5.0)
 Matrix                 1.2-15    2018-11-01 [1] CRAN (R 3.5.2)
 matrixStats            0.54.0    2018-07-23 [1] CRAN (R 3.5.0)
 mclust                 5.4.2     2018-11-17 [1] CRAN (R 3.5.0)
 memoise                1.1.0     2017-04-21 [1] CRAN (R 3.5.0)
 munsell                0.5.0     2018-06-12 [1] CRAN (R 3.5.0)
 NMF                    0.21.0    2018-03-06 [1] CRAN (R 3.5.0)
 pillar                 1.3.1     2018-12-15 [1] CRAN (R 3.5.0)
 pkgbuild               1.0.2     2018-10-16 [1] CRAN (R 3.5.0)
 pkgconfig              2.0.2     2018-08-16 [1] CRAN (R 3.5.0)
 pkgload                1.0.2     2018-10-29 [1] CRAN (R 3.5.0)
 pkgmaker               0.27      2018-05-25 [1] CRAN (R 3.5.0)
 plyr                   1.8.4     2016-06-08 [1] CRAN (R 3.5.0)
 prettyunits            1.0.2     2015-07-13 [1] CRAN (R 3.5.0)
 processx               3.2.1     2018-12-05 [1] CRAN (R 3.5.0)
 ps                     1.3.0     2018-12-21 [1] CRAN (R 3.5.0)
 purrr                  0.3.1     2019-03-03 [1] CRAN (R 3.5.2)
 R6                     2.4.0     2019-02-14 [1] CRAN (R 3.5.2)
 RColorBrewer           1.1-2     2014-12-07 [1] CRAN (R 3.5.0)
 Rcpp                   1.0.0     2018-11-07 [1] CRAN (R 3.5.0)
 RCurl                  1.95-4.12 2019-03-04 [1] CRAN (R 3.5.2)
 registry               0.5-1     2019-03-05 [1] CRAN (R 3.5.2)
 remotes                2.0.2     2018-10-30 [1] CRAN (R 3.5.0)
 reshape2               1.4.3     2017-12-11 [1] CRAN (R 3.5.0)
 rjson                  0.2.20    2018-06-08 [1] CRAN (R 3.5.0)
 rlang                  0.3.1     2019-01-08 [1] CRAN (R 3.5.2)
 rngtools               1.3.1     2018-05-15 [1] CRAN (R 3.5.0)
 rprojroot              1.3-2     2018-01-03 [1] CRAN (R 3.5.0)
 Rsamtools              1.34.1    2019-01-31 [1] Bioconductor
 rstudioapi             0.9.0     2019-01-09 [1] CRAN (R 3.5.2)
 rtracklayer            1.42.2    2019-03-01 [1] Bioconductor
 S4Vectors              0.20.1    2018-11-09 [1] Bioconductor
 scales                 1.0.0     2018-08-09 [1] CRAN (R 3.5.0)
 sessioninfo            1.1.1     2018-11-05 [1] CRAN (R 3.5.0)
 shape                  1.4.4     2018-02-07 [1] CRAN (R 3.5.0)
 stringi                1.3.1     2019-02-13 [1] CRAN (R 3.5.2)
 stringr                1.4.0     2019-02-10 [1] CRAN (R 3.5.2)
 SummarizedExperiment   1.12.0    2018-10-30 [1] Bioconductor
 survival               2.43-3    2018-11-26 [1] CRAN (R 3.5.2)
 tibble                 2.0.1     2019-01-12 [1] CRAN (R 3.5.2)
 tidyselect             0.2.5     2018-10-11 [1] CRAN (R 3.5.0)
 usethis                1.4.0     2018-08-14 [1] CRAN (R 3.5.0)
 withr                  2.1.2     2018-03-15 [1] CRAN (R 3.5.0)
 wordcloud              2.6       2018-08-24 [1] CRAN (R 3.5.0)
 XML                    3.98-1.18 2019-03-04 [1] CRAN (R 3.5.2)
 xtable                 1.8-3     2018-08-29 [1] CRAN (R 3.5.0)
 XVector                0.22.0    2018-10-30 [1] Bioconductor
 zlibbioc               1.28.0    2018-10-30 [1] Bioconductor

[1] /Library/Frameworks/R.framework/Versions/3.5/Resources/library
It's really confusing me.
When I run in other computer (Mac) with example files, I got result w/o any errors but when I run with real data, I got same error. I think the size of my samples may affect to the error...
And the error from oncoplot posted in two hours ago may be caused by my previous computer environment. Errors were not occurred in MacBook.
sessionInfo() from my previous computer is:
> sessionInfo()
R version 3.5.1 (2018-07-02)
Platform: x86_64-redhat-linux-gnu (64-bit)
Running under: CentOS Linux 7 (Core)

Matrix products: default
BLAS/LAPACK: /usr/lib64/R/lib/libRblas.so

locale:
 [1] LC_CTYPE=en_US.UTF-8       LC_NUMERIC=C               LC_TIME=en_US.UTF-8
 [4] LC_COLLATE=en_US.UTF-8     LC_MONETARY=en_US.UTF-8    LC_MESSAGES=en_US.UTF-8
 [7] LC_PAPER=en_US.UTF-8       LC_NAME=C                  LC_ADDRESS=C
[10] LC_TELEPHONE=C             LC_MEASUREMENT=en_US.UTF-8 LC_IDENTIFICATION=C

attached base packages:
[1] parallel  stats     graphics  grDevices utils     datasets  methods   base

other attached packages:
[1] usethis_1.4.0       devtools_2.0.1      maftools_1.9.21     Biobase_2.42.0
[5] BiocGenerics_0.28.0

loaded via a namespace (and not attached):
 [1] pkgload_1.0.2               splines_3.5.1
 [3] foreach_1.4.4               assertthat_0.2.0
 [5] stats4_3.5.1                BSgenome_1.50.0
 [7] GenomeInfoDbData_1.2.0      Rsamtools_1.34.0
 [9] remotes_2.0.2               sessioninfo_1.1.1
[11] backports_1.1.3             pillar_1.3.1
[13] lattice_0.20-38             glue_1.3.0
[15] digest_0.6.18               GenomicRanges_1.34.0
[17] RColorBrewer_1.1-2          XVector_0.22.0
[19] colorspace_1.4-0            cowplot_0.9.4
[21] Matrix_1.2-15               plyr_1.8.4
[23] XML_3.98-1.18               pkgconfig_2.0.2
[25] bibtex_0.4.2                zlibbioc_1.28.0
[27] purrr_0.3.1                 xtable_1.8-3
[29] scales_1.0.0                processx_3.2.1
[31] BiocParallel_1.16.2         tibble_2.0.1
[33] pkgmaker_0.27               IRanges_2.16.0
[35] ggplot2_3.1.0               withr_2.1.2
[37] SummarizedExperiment_1.12.0 lazyeval_0.2.1
[39] cli_1.0.1                   survival_2.43-3
[41] magrittr_1.5                crayon_1.3.4
[43] mclust_5.4.2                ps_1.3.0
[45] memoise_1.1.0               fs_1.2.6
[47] doParallel_1.0.14           NMF_0.21.0
[49] pkgbuild_1.0.2              prettyunits_1.0.2
[51] tools_3.5.1                 registry_0.5
[53] data.table_1.12.0           matrixStats_0.54.0
[55] gridBase_0.4-7              stringr_1.4.0
[57] S4Vectors_0.20.1            munsell_0.5.0
[59] cluster_2.0.7-1             rngtools_1.3.1
[61] DelayedArray_0.8.0          callr_3.1.1
[63] Biostrings_2.50.1           compiler_3.5.1
[65] GenomeInfoDb_1.18.1         rlang_0.3.1
[67] grid_3.5.1                  RCurl_1.95-4.12
[69] iterators_1.0.10            rstudioapi_0.8
[71] rjson_0.2.20                bitops_1.0-6
[73] gtable_0.2.0                codetools_0.2-16
[75] curl_3.2                    reshape2_1.4.3
[77] R6_2.4.0                    GenomicAlignments_1.18.0
[79] gridExtra_2.3               dplyr_0.8.0.1
[81] rtracklayer_1.42.1          rprojroot_1.3-2
[83] desc_1.2.0                  stringi_1.3.1
[85] Rcpp_1.0.0                  wordcloud_2.6
[87] tidyselect_0.2.5
And here is sessionInfo() from MacBook:
> sessionInfo()
R version 3.5.2 (2018-12-20)
Platform: x86_64-apple-darwin15.6.0 (64-bit)
Running under: macOS Mojave 10.14.3

Matrix products: default
BLAS: /System/Library/Frameworks/Accelerate.framework/Versions/A/Frameworks/vecLib.framework/Versions/A/libBLAS.dylib
LAPACK: /Library/Frameworks/R.framework/Versions/3.5/Resources/lib/libRlapack.dylib

locale:
[1] en_US.UTF-8/en_US.UTF-8/en_US.UTF-8/C/en_US.UTF-8/en_US.UTF-8

attached base packages:
[1] parallel  stats     graphics  grDevices utils     datasets  methods   base

other attached packages:
[1] maftools_1.8.0      Biobase_2.42.0      BiocGenerics_0.28.0

loaded via a namespace (and not attached):
 [1] mclust_5.4.2                ggrepel_0.8.0               Rcpp_1.0.0
 [4] lattice_0.20-38             circlize_0.4.5              Rsamtools_1.34.1
 [7] Biostrings_2.50.2           assertthat_0.2.0            digest_0.6.18
[10] foreach_1.4.4               gridBase_0.4-7              R6_2.4.0
[13] GenomeInfoDb_1.18.2         plyr_1.8.4                  stats4_3.5.2
[16] ggplot2_3.1.0               pillar_1.3.1                GlobalOptions_0.1.0
[19] zlibbioc_1.28.0             rlang_0.3.1                 lazyeval_0.2.1
[22] data.table_1.12.0           S4Vectors_0.20.1            GetoptLong_0.1.7
[25] Matrix_1.2-15               splines_3.5.2               BiocParallel_1.16.6
[28] stringr_1.4.0               RCurl_1.95-4.11             munsell_0.5.0
[31] DelayedArray_0.8.0          rtracklayer_1.42.1          compiler_3.5.2
[34] pkgconfig_2.0.2             shape_1.4.4                 pkgmaker_0.27
[37] SummarizedExperiment_1.12.0 tidyselect_0.2.5            gridExtra_2.3
[40] tibble_2.0.1                GenomeInfoDbData_1.2.0      matrixStats_0.54.0
[43] IRanges_2.16.0              codetools_0.2-16            XML_3.98-1.17
[46] crayon_1.3.4                dplyr_0.8.0.1               withr_2.1.2
[49] GenomicAlignments_1.18.1    bitops_1.0-6                grid_3.5.2
[52] xtable_1.8-3                gtable_0.2.0                registry_0.5
[55] magrittr_1.5                scales_1.0.0                bibtex_0.4.2
[58] stringi_1.3.1               XVector_0.22.0              reshape2_1.4.3
[61] doParallel_1.0.14           wordcloud_2.6               cowplot_0.9.4
[64] rjson_0.2.20                RColorBrewer_1.1-2          NMF_0.21.0
[67] iterators_1.0.10            tools_3.5.2                 BSgenome_1.50.0
[70] glue_1.3.0                  purrr_0.3.0                 rngtools_1.3.1
[73] survival_2.43-3             colorspace_1.4-0            cluster_2.0.7-1
[76] GenomicRanges_1.34.0        ComplexHeatmap_1.20.0
Hello @scha36,
Thank you for the file. I can reproduce your onocplot error but plotmafSummary works fine with no issues. Thanks @ShixiangWang for confirming it. I will fix it ASAP.
Your macbook is using 1.8.0 version of maftools which is the available on Bioconductor. The one on GitHub has several bugs fixed in last few months.
Hi,
It was a silly mistake from my side for % stats in onocplot. I have fixed it, please install from GitHub again. However I couldn't figure out the plotMafSummary since with the example data it seems to work fine.
Hi, Thanks for your reply. Now the stat works fine. But still, no plots were shown in the left side when run oncoplot and same error (plot not seen) was seen in the output of oncostrip in my MacBook.
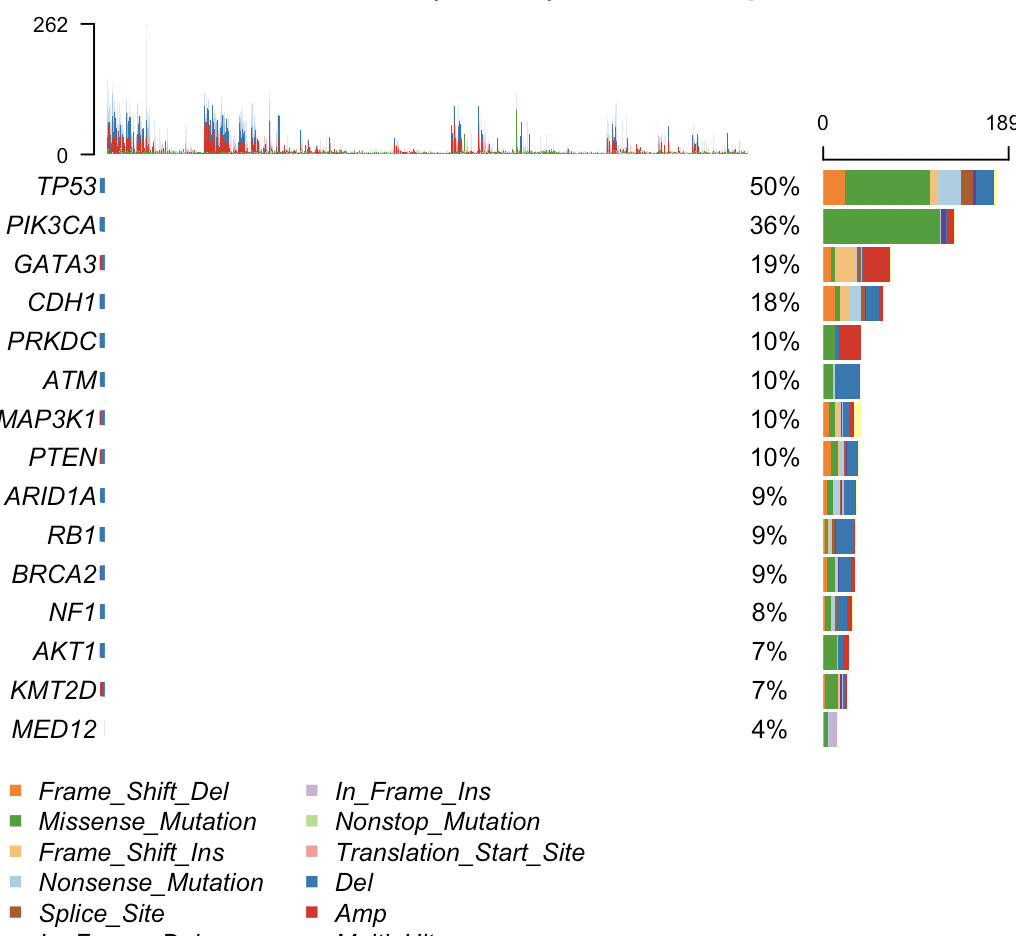
Hi, Maybe I am missing something here, but this is the whole plot. There should not be anything to the left side of the oncoplot. Are you referring to the middle part of the plot ?
Yes. I mean the middle part of the plot. There may be plot shows variants types, but nothing was shown, only white background.
I am pretty sure its being plotted. Its just your cohort size is so huge that the grids become invisible. If you're using Rstudio press zoom tab on plotting window and they should be visible. Or save the plot to a big pdf and view it.
pdf(file = "oncoplot.pdf", width = 12, height = 12, paper = "special", bg = "white")
oncoplot(maf = maf)
dev.off()
Let me know if this fixes your problem.
Um.. Doing with pdf works fine only for oncostrip. The plot was not shown in PDF when I run oncoplot. I guess some other thing affect this issue, because I got visible plot in previous test few hours ago. PDF I saved in few hours ago showed plot with various variant types, but PDF saved in now does not show any variant types. Something's unstable, I think. Maybe big size of samples is one of the reasons.
Are you sure you're saving it properly ? What happens when you zoom the plotting window from Rstudio, do you still see the blank plot ? Can you start fresh R session and save the plot again.
Yes, I saved it properly and when I zoom the plotting window, there's still a blank plot.
I've restart R session, but still the issue was occurred.
To test whether big size of samples is the reason of this issue, I run oncoplot with example samples attached above.
When I got PDF with width=12, 20 or 30, plot was more visible in bigger size of PDF (oncoplot_ex.pdf, oncoplot_ex2.pdf, oncoplot_ex3.pdf), but as you can see, oncoplot_ex3.pdf is not so visible than expected. I wonder your thought.
oncoplot_ex3.pdf
oncoplot_ex2.pdf
oncoplot_ex.pdf
Yup, its definitely cohort size. Larger cohort will result in more blanks (white) which over-shadows rest of the entries. I will see if I can find a wrokaround by increasing grid sizes.
I got the same error ow names must be 'character' or 'integer', not 'integer' In my case the solution was very simple. The Hugo_Symbol column in the cnTable was a factor. I cast it as.character and the problem resolved.
The same problem happened
I guess, it will occur when load data.frame to read.maf function and load resulted object to plotmafSummary function.
As @ejoffe19 have mentioned in https://github.com/PoisonAlien/maftools/issues/261#issuecomment-513604988, cast Hugo_Symbol as.character input data frame of read.maf function or set stringsAsFactors = FALSE when load MAF file, will solve the problem.
I think, the error occurred in following line.
https://github.com/PoisonAlien/maftools/blob/b14aeb9c1e1da533a527e3d8f3c3c26ba6497da0/R/dashboard.R#L177
The same problem still happened to me (maftools: 2.2.10), setting "stringsAsFactors = FALSE" while using "read.delim" to read in maf files has solved the problem. Maybe it has not been fixed, but setting "stringsAsFactors = FALSE" is an option.