pycyphal
 pycyphal copied to clipboard
Provide a generalized interface for transport log replay capabilities
There may be different means of recording and replaying transport logs for diagnostic purposes. One existing solution is pycyphal.transport.can.media.candump.CandumpMedia. The following requirements are common for all log replay pseudo-transports:
- Report the origin and final timestamps of the log file (min and max timestamp value).
- Report the number of transport frames in the log file.
- Report the current position of the replay cursor as:
- timestamp (origin timestamp initially);
- index of the transport frame (0 initially).
- Position the replay cursor immediately before:
- the specified time point;
- the specified frame index.
- Resume/pause the replay.
- Set the replay speed (1.0 is the default).
- Single-stepping: replay one frame (disregarding the timing) and pause.
- Report the name of the underlying resource (file path).
Note that estimation of the final timestamp and the total number of frames would often require full traversal of the log file, which may be very costly. The API should be designed with that cost in mind.
The existing CandumpMedia should implement this interface.
To facilitate the proper integration of the log replay capability into user-level software, it might be sensible to extend the pycyphal.transport.Transport interface with a new method that checks whether the transport in its current configuration is connected to a log file. If the transport is connected to a live network, the method would return nothing; otherwise, it would return an instance implementing this playback interface. Higher-level software will be able to benefit from it in the following manner:
- Yakut would be able to report the current progress via stderr and automatically exit when the file is fully replayed.
- A GUI tool like Yukon will be able to present the user with a nice UI like this:
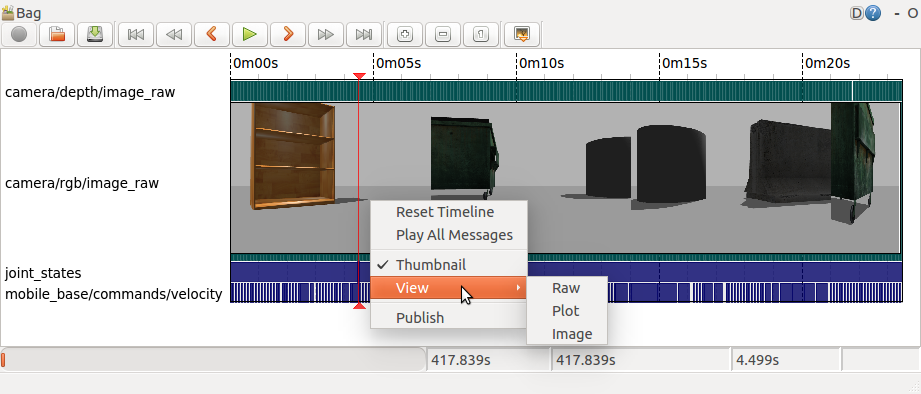
One feature not covered here is the ability to scan the log file for all transport frames at once. This will be required by graphical tools to present the user with a high-level analysis of the log file contents (see the screenshot above): which ports are available, how the traffic intensity is distributed across the log file per port, whether there are transport errors or other noteworthy events, etc. There are at least two obvious ways to approach this:
-
Implement a dedicated method that returns an async iterator going over every recorded item frame in the log file. The items will be returned as instances of
pycyphal.transport.Capture. The caller will then handle them the same way captured traffic is handled: by feeding them into apycyphal.transport.Tracerinstance. -
Implement a cloning method that allows the caller to construct an independent copy of the entire transport fully detached from its original owner, then invoke
begin_capture()on that transport instance. The result would be identical to the above.
Relates to https://github.com/OpenCyphal/yakut/issues/1
@silverv @thirtytwobits FYI