AlgebraOfGraphics.jl
 AlgebraOfGraphics.jl copied to clipboard
Combine ingredients for a plot
## Problem description I'm not sure if AoG is the right place to do this or if it should be part of Makie or even a separate package. Matplotlib (and...
## Problem description Let’s say I have a dataframe with these columns ``` class curve_id s u u̇ x y ω ``` and I want to do a scatter plot...

## Bug description `MethodError` is thrown when trying to use `smooth()` with a `::Date` column mapped to an axis. Seem like I get to be the guinea pig to find...
Marked as draft as we may go for a different approach, described in #329
Faceting fails silently when the faceted variable is numeric. ```julia df = (x=rand(100), y=rand(100), j=rand(1:6, 100)) plt = data(df) * mapping(:x, :y, row=:j) draw(plt) ``` This plots all points in...
Issue in response to [this discourse thread](https://discourse.julialang.org/t/order-of-legend-entries-in-algebraofgraphics/77753/4). Specifying a color sorter to reorder legend entries when a palette with pairs of labels and colors is used errors: ```julia labels =...
AlgebraOfGraphics don't seem to handle missing values the same as Makie. Consider 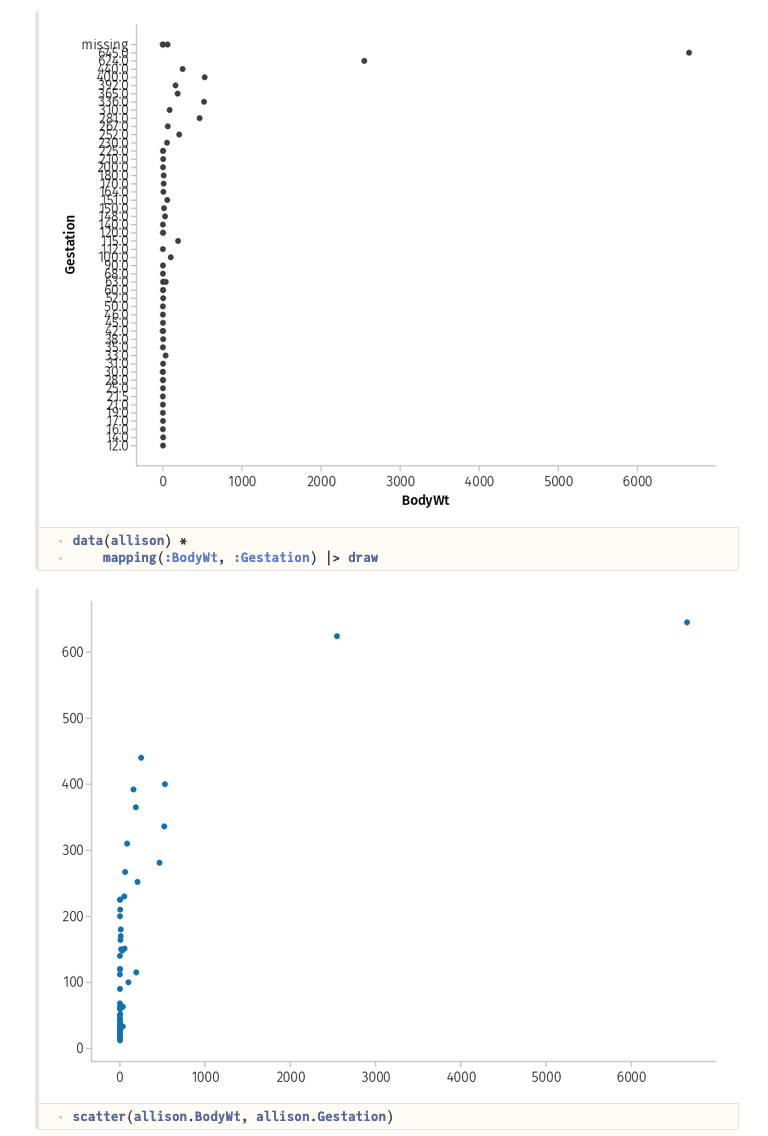 Using `dropmissing` on the full DataFrame is not viable, as the missings...
`visual(BarPlot, direction=:x)` links the x-axes as usual, which is wrong in this case.
I know there is `AlgebraOfGraphics.density()` but I would also like `visual(Density)` to work. `strokecolor` doesn't work in the `mapping`. ```jl let n = 100 (data((;a=rand(n),c=rand('a':'e', n))) * mapping(:a, strokecolor=:c) *...
## Bug description When trying to specify multiple columns for attrs like `color`, I am unable to do so: ```julia df1 = DataFrame(a=[1, 2], b=[3, 4], c = ["x","y"], d...