AlgebraOfGraphics.jl
 AlgebraOfGraphics.jl copied to clipboard
Published
20 hours ago •
 JuliaPlots
Colorbar for each subplot
Problem description
Let’s say I have a dataframe with these columns
class curve_id s u u̇ x y ω
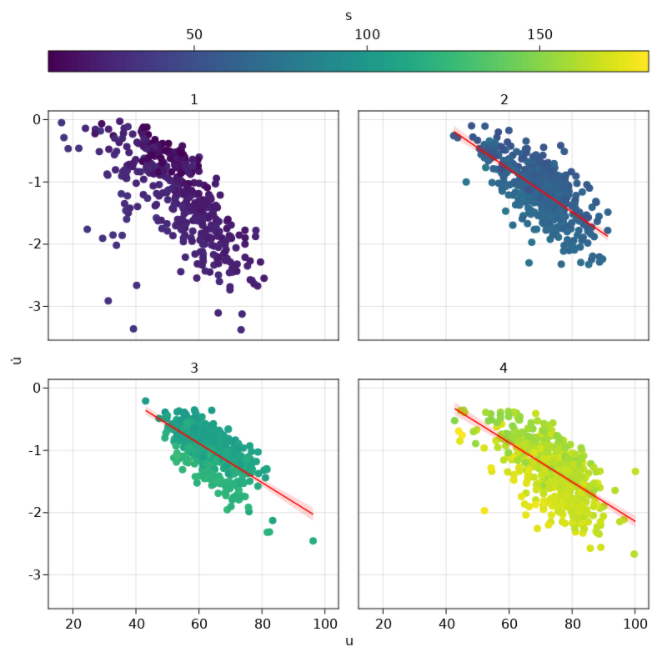
and I want to do a scatter plot u against u̇ in 4 separate subplots based on the values of the categorical column curve_id. Let’s also say I want the scatter plots to be colored according to s, then I can do this:
graph = data(slowing) * mapping(:u, :u̇,  color=:s, layout = :curve_id => nonnumeric) *
    (
        (visual(Scatter, colormap=:viridis) + linear() * visual(color="red", lw=3))
    )
fg = draw(graph; figure = (resolution = (800, 800),), colorbar=(position=:top, size=25))
which gives the image below. My question is: is there a way to have the colors/colorbar apply to each subplot individually? I want the colors to reflect changes in s in each subplot rather than across subplots.
Proposed solution
Provide a function/attribute to specify that the color mapping should apply to each subplot individually. Not only we should have 4 colorbars, but in each subplot the colors should span the entire range of colors in the cmap.