lets-plot
 lets-plot copied to clipboard
Multiplatform plotting library based on the Grammar of Graphics
See: http://ggplot2.tidyverse.org/reference/geom_point.html > For shapes that have a border (like 21), you can colour the inside and outside separately. Use the stroke aesthetic to modify the width of the border...

See nb: https://github.com/JetBrains/lets-plot/blob/master/docs/examples/jupyter-notebooks-dev/issues/map_tile_tooltip.ipynb The tooltip is working on all plots except the last one.
```python from lets_plot import * LetsPlot.setup_html() data = {'x': [0, 1], 'y': [0, 1], \ 'text': ['Lorem ipsum #1', 'Lorem ipsum #2']} ggplot(data, aes('x', 'y')) + geom_text(aes(label='text')) ```
[Mapping US Household Income](https://www.kaggle.com/alshan/mapping-us-household-income) - Sometimes am even unable to pan - so slow it is. - May be cursor should change shape on start. - Show spinner if redrawing...
If we pick a point on map, shift the map and then paste the code 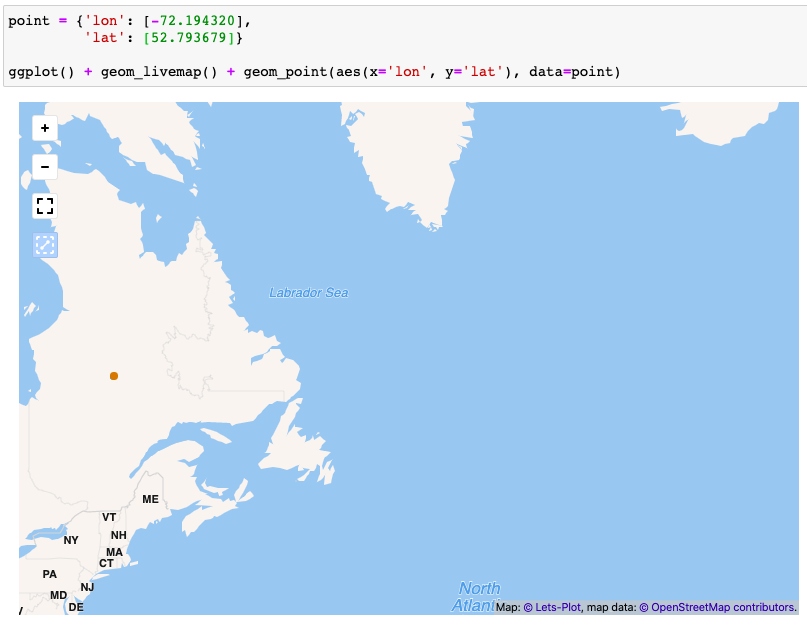 the coordinates will be shifted too ``` geometry = { 'lon': [-72.106429], 'lat': [52.829095]...
Look at the following example: ```python from datetime import datetime import pandas as pd from lets_plot import * LetsPlot.setup_html() df = pd.DataFrame( { 'd': pd.to_datetime( [ datetime(1972, 6, 9), datetime(1972,...
Now, to use the "location" parameter I have to transform geocoder object into a pair [lon, lat] (or to a dataframe with lon/lat columns): ``` gcoder_Beijing = geocode_cities("Beijing") point =...
``` gcoder = geocode_cities("St.Petersburg") ``` > ValueError: No objects were found for St.Petersburg. ``` gcoder = geocode_cities("St.-Petersburg") ``` > ValueError: Multiple objects (2) were found for St.-Petersburg: > - St....
Look at the following example: ```python from lets_plot import * LetsPlot.setup_html() ggplot({'x': [0], 'y': [0]}, aes('x', 'y')) + layer('point', size=20, color='red') ``` It produces the wrong picture, without any aesthetics...