ylim() crops plot when position='fill'
Minimal reproducible example:
data = {
    'x': [0, 0, 0],
    'g': ['a', 'a', 'b'],
}
ggplot(data, aes(x='x', fill='g')) + \
    geom_bar(position='fill') + \
    ylim(0, 1)
Output:

Expected (as in ggplot2):
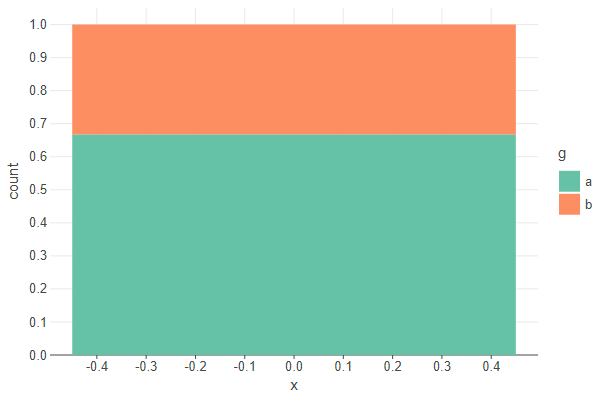
This might be an expected behavior: data point "a" has value 2.0.
Limits ylim(0, 1) filter data - keep all data points which value is in range [0, 1], and discard all the rest. Thus, "a" got discarded.
ggplot2 behavior looks strange and doesn't match their documentation:
Note that setting limits on positional scales will remove data outside of the limits. If the purpose is to zoom, use the limit argument in the coordinate system
https://ggplot2.tidyverse.org/reference/scale_continuous.html
Experimenting with ggplot2 I came to the conclusion that if there is no statistic, then ylim() is actually applied to the data. But if y is taken from the statistic, it seems that ylim() is applied to the calculated ..y.. with positioning taken into account.
This looks inconsistent, apart from the fact that it contradicts the ggplot2 documentation.
I suggest closing the issue as not requiring fixing.