yellowbrick
 yellowbrick copied to clipboard
Visual analysis and diagnostic tools to facilitate machine learning model selection.
This is an initial issue to track and research incorporating interactive Jupyter Notebook widgets into yellowbrick. Likely any outputs from this would be well placed in the `contrib` module A...

Clustering scores like silhouette work well for K-Means but make less sense for density based clustering techniques like DBSCAN which support arbitrary cluster shapes. It would be nice to include...
@ianozsvald suggested an interesting extension to the Confusion Matrix: one which displays a histogram of probabilities in each square: 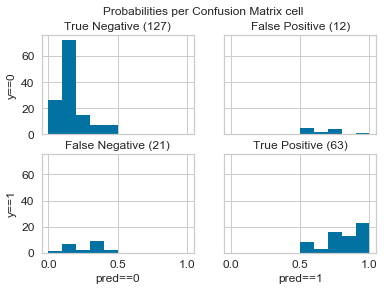 Code is here: https://github.com/ianozsvald/data_science_delivered/blob/master/ml_creating_correct_capable_classifiers.ipynb
Presumably the following code should find the max number of thresholds found across all the trials so as not to ignore the values in the densest threshold list across all...
A dendrogram illustrates how each cluster is composed by drawing a U-shaped link between a non-singleton cluster and its children. The top of the U-link indicates a cluster merge. The...
Whenever I use a ROC plot I have to refresh myself about what it means. In particular - what do the axis labels _mean_ and where are the thresholds on...
These are a couple examples to add to the radviz visualization. That way it could be easier to see the "pull-force" from every direction http://docs.orange.biolab.si/2/widgets/rst/visualize/radviz.html Hope it helps! Best, Abe
Two of the code examples in the [validation curve documentation](https://www.scikit-yb.org/en/latest/api/model_selection/validation_curve.html) can take hours to run even with joblib parallelism. There is a warning in the documentation about this -- the...
**Describe the solution you'd like** The [`yellowbrick.style.colors.ColorMap`](https://github.com/DistrictDataLabs/yellowbrick/blob/develop/yellowbrick/style/colors.py#L124) object is one of the most underutilized objects in our code base and it solves many of the color issues we have such...
The `InterclusterDistance` visualizer is our newest cluster visualization, and while it's been implemented completely, there are still a few updates I'd like to make to it: - [ ] Ensure...
Metadata
Owner
Metadata
Visual analysis and diagnostic tools to facilitate machine learning model selection.