yellowbrick
 yellowbrick copied to clipboard
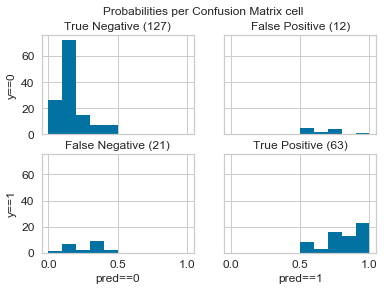
Confusion Matrix Probability Histogram
@ianozsvald suggested an interesting extension to the Confusion Matrix: one which displays a histogram of probabilities in each square:
Code is here:
https://github.com/ianozsvald/data_science_delivered/blob/master/ml_creating_correct_capable_classifiers.ipynb
Hi @ajaysub110 you're more than welcome to submit a PR for this, thanks for your interest in contributing to Yellowbrick!
Hello Ajay. I'd be happy to review your contribution, thanks for picking up on the idea. Ian
On Sat, 16 Feb 2019, 11:12 Benjamin Bengfort <[email protected] wrote:
Hi @ajaysub110 https://github.com/ajaysub110 you're more than welcome to submit a PR for this, thanks for your interest in contributing to Yellowbrick!
— You are receiving this because you were mentioned. Reply to this email directly, view it on GitHub https://github.com/DistrictDataLabs/yellowbrick/issues/749#issuecomment-464337395, or mute the thread https://github.com/notifications/unsubscribe-auth/AAQrOsmjujkfxDaUY-fb1-p3m0vhHAh3ks5vN-eIgaJpZM4a8uSz .
Can you give some background on how you've setup your environment please? What package manager so you have (Windows? System python? Venv? Other?) Have you taken a fresh checkout of YB from GitHub, via a Fork? Have you followed the contributor guidelines and checked that all the tests run to completion first? https://www.scikit-yb.org/en/latest/contributing.html Ian
On Sun, 17 Feb 2019, 07:29 Ajay Subramanian <[email protected] wrote:
Quick question. How do I test a single file (confusion_matrix.py in this case?). Its giving me some import errors due to relative imports being used in the code.
What I tried I tried adding the path of the utils and style folders to the system path as follows: sys.path.insert(0,'/home/ajays/Desktop/yellowbrick/yellowbrick');
When I print out the system path, the directory I want is there, but it's not working for some reason. ['/home/ajays/Desktop/yellowbrick/yellowbrick', '/home/ajays/Desktop/yellowbrick/yellowbrick/classifier', '/home/ajays/anaconda3/lib/python36.zip', '/home/ajays/anaconda3/lib/python3.6', '/home/ajays/anaconda3/lib/python3.6/lib-dynload', '/home/ajays/.local/lib/python3.6/site-packages', '/home/ajays/anaconda3/lib/python3.6/site-packages', '/home/ajays/anaconda3/lib/python3.6/site-packages/pycocotools-2.0-py3.6-linux-x86_64.egg', '/home/ajays/anaconda3/lib/python3.6/site-packages/mask_rcnn-2.1-py3.6.egg', '/home/ajays/mujoco-py-1.50.1.0']
Open to suggestions. Thanks
— You are receiving this because you were mentioned. Reply to this email directly, view it on GitHub https://github.com/DistrictDataLabs/yellowbrick/issues/749#issuecomment-464425131, or mute the thread https://github.com/notifications/unsubscribe-auth/AAQrOqZua1xtmm1zFcXpnJ8JYSLnAjKSks5vOQTCgaJpZM4a8uSz .
I've set up a virtualenv environment and installed packages using pip. I'm working on the updated fork on the develop branch. I'm actually stuck on running the tests themselves. The contribution guidelines provide the following code template to test visualizers
import pytest
from tests.base import VisualTestCase
from tests.dataset import DatasetMixin

class MyVisualizerTests(VisualTestCase, DatasetMixin):

    def test_my_visualizer(self):
        """
        Test MyVisualizer on a real dataset
        """
        # Load the data from the fixture
        dataset = self.load_data('occupancy')

        # Get the data
        X = dataset[[
            "temperature", "relative_humidity", "light", "C02", "humidity"
        ]]
        y = dataset['occupancy'].astype(int)

        try:
            visualizer = MyVisualizer()
            visualizer.fit(X)
            visualizer.poof()
        except Exception as e:
            pytest.fail("my visualizer didn't work")
However, I'm unfamiliar as to which directory I need to run the test from since it gives me an ImportError when I try to import modules like utils, tests, etc. that lie in a higher directory
ImportError: attempted relative import with no known parent package.
The path of the file I'm modifying (confusion_matrix.py) is yellowbrick/classifiers/confusion_matrix.py while the utils module (which is being used in the file for the div_safe method) is in the yellowbrick directory.
I have written a basic part of the code for the confusion histogram. All I need to know is how to test if it's working right now. Ajay
Let me confirm where you are. You note that you've followed https://www.scikit-yb.org/en/latest/contributing.html and I think you're saying that you've followed https://www.scikit-yb.org/en/latest/contributing.html#forking-the-repository with steps 1-4 (finishing with a develop branch) - right?
Under the Testing section it notes $ make test - does that run for you?
I think you might be trying to make a new test before you've confirmed that the existing tests all run ok. Can you undo any of your changes (or switch to a new branch off of the develop branch from YB) and confirm that the existing tests all run ok? From memory (I don't have this checked out and to hand) you do this from the top level folder.
Once you have the existing tests running, you should be able to add a new bit of code which will form the basis of your new tests. Make something that breaks like add 1/0 in the new test, then run all the tests again as before, confirm that your breaking test is identified, then you can work up from there.
If I've given bad guidance or misunderstood where you're at, do say!
I'll note that it took me a while to get the tests running on my Linux machine a year back (issues fixed by Ben), so take it slow to make sure this is all running for you before you crack on with new code: https://github.com/DistrictDataLabs/yellowbrick/issues/389
Thanks for the guidance. I'll take a look at the existing tests and try to fix them before I move on
As you suggested, I ran make test on the original fork (without my changes).
910 passed, 18 skipped, 7 xfailed, 142 warnings in 529.70 seconds
Are the 7 errors something to be alarmed about? I'm working on Ubuntu 18.04 + Python.
I don't know what an "xfailed" result means, perhaps they're marked as being expected to fail (due to other changes occurring in the code base)? I think you're in good shape. Maybe post one of those as an example here? I think next try to add a placeholder test with a 1/0 into the existing tests, then build up. Noting your progress here would be useful because maybe we can update the Contributor docs with some new feedback later.
On Sun, 17 Feb 2019, 13:10 Ajay Subramanian <[email protected] wrote:
But none of the tests failed with 'F'. So I guess that's alright?
— You are receiving this because you were mentioned. Reply to this email directly, view it on GitHub https://github.com/DistrictDataLabs/yellowbrick/issues/749#issuecomment-464455263, or mute the thread https://github.com/notifications/unsubscribe-auth/AAQrOkr5h_6Z7GRR8wVGRYIXbi0A7hMUks5vOVTLgaJpZM4a8uSz .
According to what I've observed, the 'xfailed' result has occurred only for the image comparison tests, which I guess are more probable since they involve pixel comparisons. Meanwhile, I've added a test for the histogram and am in the process of fixing errors now. Sorry. I'm unfamiliar with what a 'placeholder test with a 1/0' is. Could you elaborate please?
Sounds like progress. When I work on new code I always write a test that should fail (eg it contains a divide by zero line). I then run all the tests. If they don't fail...I made a mistake somewhere and my new test wasn't included, which needs fixing. The risk if you avoid this step is that you write a test which you think is working... But it never tests the code you're writing. This has bitten me before so I always start here. Just stick a 1/0 in your new test code, run all tests, confirm for yourself that it does fail and then all is good. Keep me updated, you're making good progress.
On Sun, 17 Feb 2019, 14:11 Ajay Subramanian <[email protected] wrote:
According to what I've observed, the 'xfailed' result has occurred only for the image comparison tests, which I guess are more probable since they involve pixel comparisons. Meanwhile, I've added a test for the histogram and am in the process of fixing errors now. Sorry. I'm unfamiliar with what a 'placeholder test with a 1/0'. Could you elaborate please?
— You are receiving this because you were mentioned. Reply to this email directly, view it on GitHub https://github.com/DistrictDataLabs/yellowbrick/issues/749#issuecomment-464461979, or mute the thread https://github.com/notifications/unsubscribe-auth/AAQrOoTpr5gwpmy9vqxv59YbI4Z7KpgCks5vOWMogaJpZM4a8uSz .
@ianozsvald @ajaysub110 thanks for all your hard work on this! I just wanted to chime in to confirm some of your questions:
-
xfailedis "expected failure" and is no cause for concern. As you mentioned @ajaysub110 - it's likely because a font or something is missing from your system that would throw the image comparisons off. -
If you're adding a new visualizer to
yellowbrick/classifiers/confusion_matrix.pythen you could write the tests for that visualizer intests/test_classifiers/test_confusion_matrix.py-- from the project root you can then runpytest tests/test_classifiers/test_confusion_matrix.pyand that should run only your tests (and the other confusion matrix tests), which hopefully will simplify the development process.
Hope these notes help and thanks again!
I see. Thanks. I'll keep that in mind.
I've been stuck on something for almost a day now. But before that, there are two important things to note here, in the problem, that I'm not allowed to modify in any way:
- The Figure object is not passed as a constructor parameter to the class; only the Axes object is. So the subplots object cannot be modified in any way.
- The Axes parameter is set to that of a (1,1) figure, by default (as below). All the modification required to make it an (m,n) figure are performed within the class (inside its methods)
# Calling the ConfusionMatrix class
_, ax = plt.subplots() # By default creates (1,1) dimension figure
model = SVC(random_state=93, probability=True)
cm = ConfusionMatrix(model, ax=ax, histogram=True) # calling the CM class with hist parameter set to True
What I'm stuck on:
Since I want to plot histograms within each cell, my approach is to loop over each cell and create a histogram in each.
results[col].hist(ax=self.ax[y,x], bins=bins)
However, I'm not able to specify the axes of the histogram in any way. This is because the Axes parameter passed is of default dimension (1,1) and hence not index-able. When I try this I get a TypeError saying.
TypeError: 'AxesSubplot' object is not subscriptable
With all this considered, I would like to know of any possible ways I can add my histogram to the parent Axes object. Thanks for taking a look.
Hi @ajaysub110 yes - this is a tricky problem that we also have in our JointPlot visualizer, ResidualsPlot, and others. We are very reluctant to manage the entire figure since we want to be able to use Yellowbrick to create reports, etc. So what we have been doing is using make_axes_locatable and dividing up the area that the axes as in:
- https://stackoverflow.com/questions/40500710/how-can-i-use-matplotlib-divider-to-split-a-subplot-into-more-than-two-parts?rq=1
- https://stackoverflow.com/questions/54545758/create-equal-aspect-square-plot-with-multiple-axes-when-data-limits-are-differ
This is tricky and we're trying to figure out a better solution or at least some utilities in Yellowbrick that will make this easier. As you prototype, if you'd like to use GridSpec - I think that's fair game. You can get access to the current figure using plt.gcf or plt.get_current_figure.
Also one note - for the prototype would you mind creating a new visualizer that subclasses ConfusionMatrix e.g. class ConfusionProbabilityMatrix(ConfusionMatrix)? This will make it far easier for us to review!
Thanks for your insight into this issue. I check the links out. Also, just to confirm, you want me to create a subclass for ConfusionMatrix, and embed the new histogram feature into that, correct?
I think I've completed a basic version of the ConfusionProbabilityMatrix using gridspec, and a primitive test file for that (that I copied off of the test_confusion_matrix.py file). According to the Contributing page, the image comparison test will fail initially due to there being no baseline image, after which I should see an image in the actual_images directory. However, for some reason, I don't see any thing even after I run the test. What could possibly be the problem?
My test function:
        _, ax = plt.subplots()

        model = GaussianNB()
        cm = ConfusionProbabilityMatrix(model, ax=ax, classes=None)
        cm.fit(self.digits.X.train, self.digits.y.train)
        cm.score(self.digits.X.test, self.digits.y.test)

        self.assert_images_similar(cm, tol=10)
And the error I get after the test:
AttributeError: 'NoneType' object has no attribute 'dpi_scale_trans'
@ajaysub110 that method is called off of the Figure, though it does not appear in Yellowbrick as far as I can tell. Could you provide a complete traceback, please?
self = <tests.test_classifier.test_confusion_probability_matrix.ConfusionProbabilityMatrixTests testMethod=test_no_classes_provided>

    def test_no_classes_provided(self):
        """
        Integration test on digits dataset with GaussianNB, no classes
        """
        _, ax = plt.subplots()

        model = GaussianNB()
        cm = ConfusionProbabilityMatrix(model, ax=ax, classes=None)
        cm.fit(self.digits.X.train, self.digits.y.train)
        cm.score(self.digits.X.test, self.digits.y.test)

>       self.assert_images_similar(cm, tol=10)

tests/test_classifier/test_confusion_probability_matrix.py:87:
_ _ _ _ _ _ _ _ _ _ _ _ _ _ _ _ _ _ _ _ _ _ _ _ _ _ _ _ _ _ _ _ _ _ _ _ _ _ _ _ _ _ _ _ _ _ _ _ _ _ _ _ _ _ _ _ _ _ _ _ _ _ _ _ _ _ _ _ _ _ _ _ _ _ _
../envs/yellowbrick/lib/python3.6/site-packages/matplotlib/axes/_axes.py:227: in set_title
    self._set_title_offset_trans(float(pad))
_ _ _ _ _ _ _ _ _ _ _ _ _ _ _ _ _ _ _ _ _ _ _ _ _ _ _ _ _ _ _ _ _ _ _ _ _ _ _ _ _ _ _ _ _ _ _ _ _ _ _ _ _ _ _ _ _ _ _ _ _ _ _ _ _ _ _ _ _ _ _ _ _ _ _

self = <matplotlib.axes._subplots.AxesSubplot object at 0x7f57465c27f0>, title_offset_points = 6.0

    def _set_title_offset_trans(self, title_offset_points):
        """
        Set the offset for the title either from rcParams['axes.titlepad']
        or from set_title kwarg ``pad``.
        """
        self.titleOffsetTrans = mtransforms.ScaledTranslation(
                0.0, title_offset_points / 72,
>               self.figure.dpi_scale_trans)
E       AttributeError: 'NoneType' object has no attribute 'dpi_scale_trans'

../envs/yellowbrick/lib/python3.6/site-packages/matplotlib/axes/_base.py:1145: AttributeError```
Well, I can certainly say I've never seen that before. I've Googled around and haven't come up with anything. A couple of important questions come to mind:
- In your
ConfusionProbabilityMatrix.__init__are you callingsuperwith theaxobject? - Do you happen to know the version of matplotlib you've got installed?
- Do you have a custom rcParams set by any chance?
If we can't figure it out, perhaps you could open a "draft PR" (this is a new GitHub feature) and @ianozsvald and I could take a look at the code directly?
- Yes.
super(ConfusionProbabilityMatrix, self).__init__(model, ax=ax, classes=classes, label_encoder=label_encoder, **kwargs) - I have matplotlib 3.0.2 installed
- Not that I know of Yeah sure. I'll open one right away
Or if you just have prototype code, feel free to post it here as a gist if you're not ready to open a PR.
There's the code for the class. I think the problem is that the final 'current_ax' object is being considered as a numpy array rather than a plt.axes.Axes instance. Thanks for taking a look.
I ran the prototype manually (on handmade data) using this code. And it seems to be working just fine with no errors. So I assume there's no problem with the logic. Here's the gist link and here's the output histogram matrix. Also, were you able to take a look at the code for the class that I had put up earlier?