azure-monitor-datasource
 azure-monitor-datasource copied to clipboard
Grafana data source for Azure Monitor/Application Insights (deprecated - now included in core Grafana)
When Resource Group tons of resources that cannot returned from one single REST request. It should follow the "nextLink" to get all resources. ```json { "value": [ { "id": "/subscriptions/dddddddd-e7a1-44ba-beef-4c6a323b773e/resourceGroups/my-sql-servers/providers/Microsoft.Sql/servers/my-sql-server",...

Support MetricNamespace field to query CustomMetrics (like Telegraf metrics) Docs: https://docs.microsoft.com/en-us/rest/api/monitor/metricnamespaces/list https://docs.microsoft.com/en-us/rest/api/monitor/metricdefinitions/list https://docs.microsoft.com/en-us/rest/api/monitor/metrics/list
Hi team, Documentation on "Templating with Variables" suggest that there are two filters: > https://github.com/grafana/azure-monitor-datasource#templating-with-variables * AppInsightsMetricNames() | Returns a list of metric names. * AppInsightsGroupBys(aMetricName) | Returns a list...
@daniellee We at azure solutions and azure cat team have scenarios for enterprise customers at high rank. For example Adobe one of our customers. So there is a requirement for...
Plugin version: 0.1.1 Grafana version: 5.2.1 Not sure about scope of this issue grafana or plugin. Confusing to see values while it null 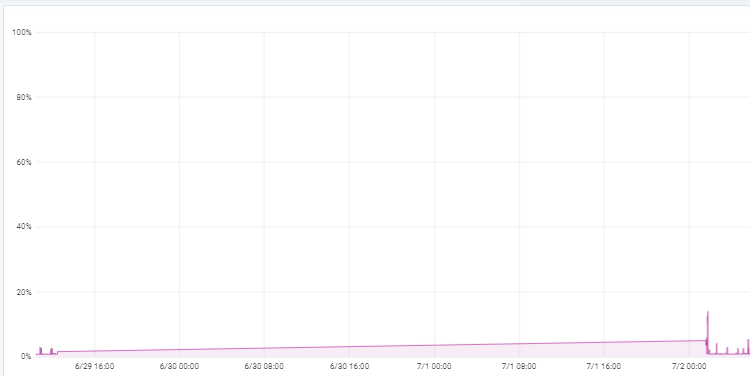 What happens if I zoom 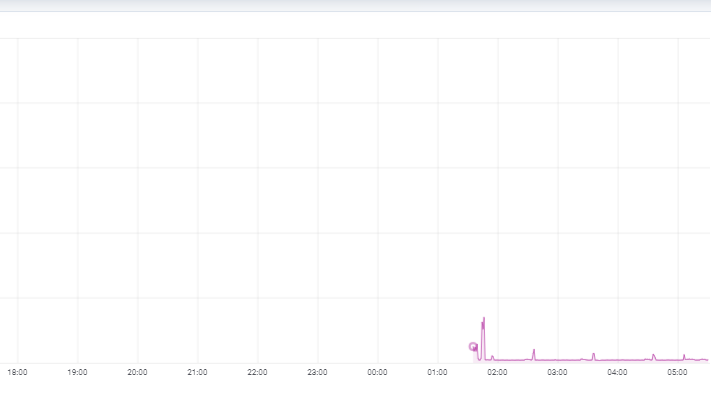...
Is it possible to add a mathematical multiplier to the aggregation result? For instance, when Iquey CosmosDB I get average RU per minute, but need to graph average RU per...
Hi, it seems at the moment it's not possible to get the quota of a provisioned IoT Hub resource from within Azure. The plugin already supports various kinds of metrics...
Example error from query inspector: { "xhrStatus": "complete", "request": { "method": "GET", "url": "api/datasources/proxy/2/azuremonitor/subscriptions//resourceGroups/{rgA,rgB}/resources?api-version=2018-01-01" }, "response": { "error": { "code": "InvalidResourceGroup", "message": "The provided resource group name '{rgA,rgB}' has these...
Hello All, I'm trying to configure Azure monitor plugin with azure log analytics feature enable. However I’m not sure about the auth02 configuration which is a last part of it....
Plugin Version: 0.3.0 Grafana Version: 5.4.2 **Steps to reproduce** 1. Set up Azure Monitor plugin and configure a dashboard to consume data from it. 2. Everything works great. 3. Leave...