Daniel Schunack
Daniel Schunack
Hi @kbrwn , I found a running kubecost that consumed only 3GB, the most crashes in seconds. Logs are attached and also the profile/heap. Hope it helps. [cost-model.log](https://github.com/kubecost/cost-model/files/8234628/cost-model.log) [profile.log](https://github.com/kubecost/cost-model/files/8234640/profile.log) [heap.log](https://github.com/kubecost/cost-model/files/8234643/heap.log)
Hi, here are the information's. We use EKS 1.21 and the Node is a r5a.2xlarge x86_64. Storage Class is EBS GP3 docker 20.10.7 kernel: 5.4.176-91.338.amzn2.x86_64 k8s: v1.21.5-eks-9017834 ` kubectl -n...
Hi @AjayTripathy, It's the real memory usage of the costs-model container and on r5a.4xlarge instance it used a large amount of memory. I will change it in our dev environment...
Hi @kbrwn , I will test the new release tomorrow. Thanks for the Info.
Hi @kbrwn , I tested it today with the latest release v1.91.2, but it still consumed a lot of memory and crashed. It's running on one of our EKS and...
Hi @kbrwn , yes, we see a lot of results and Prometheus is working fine. ~5400 for the last 6h. 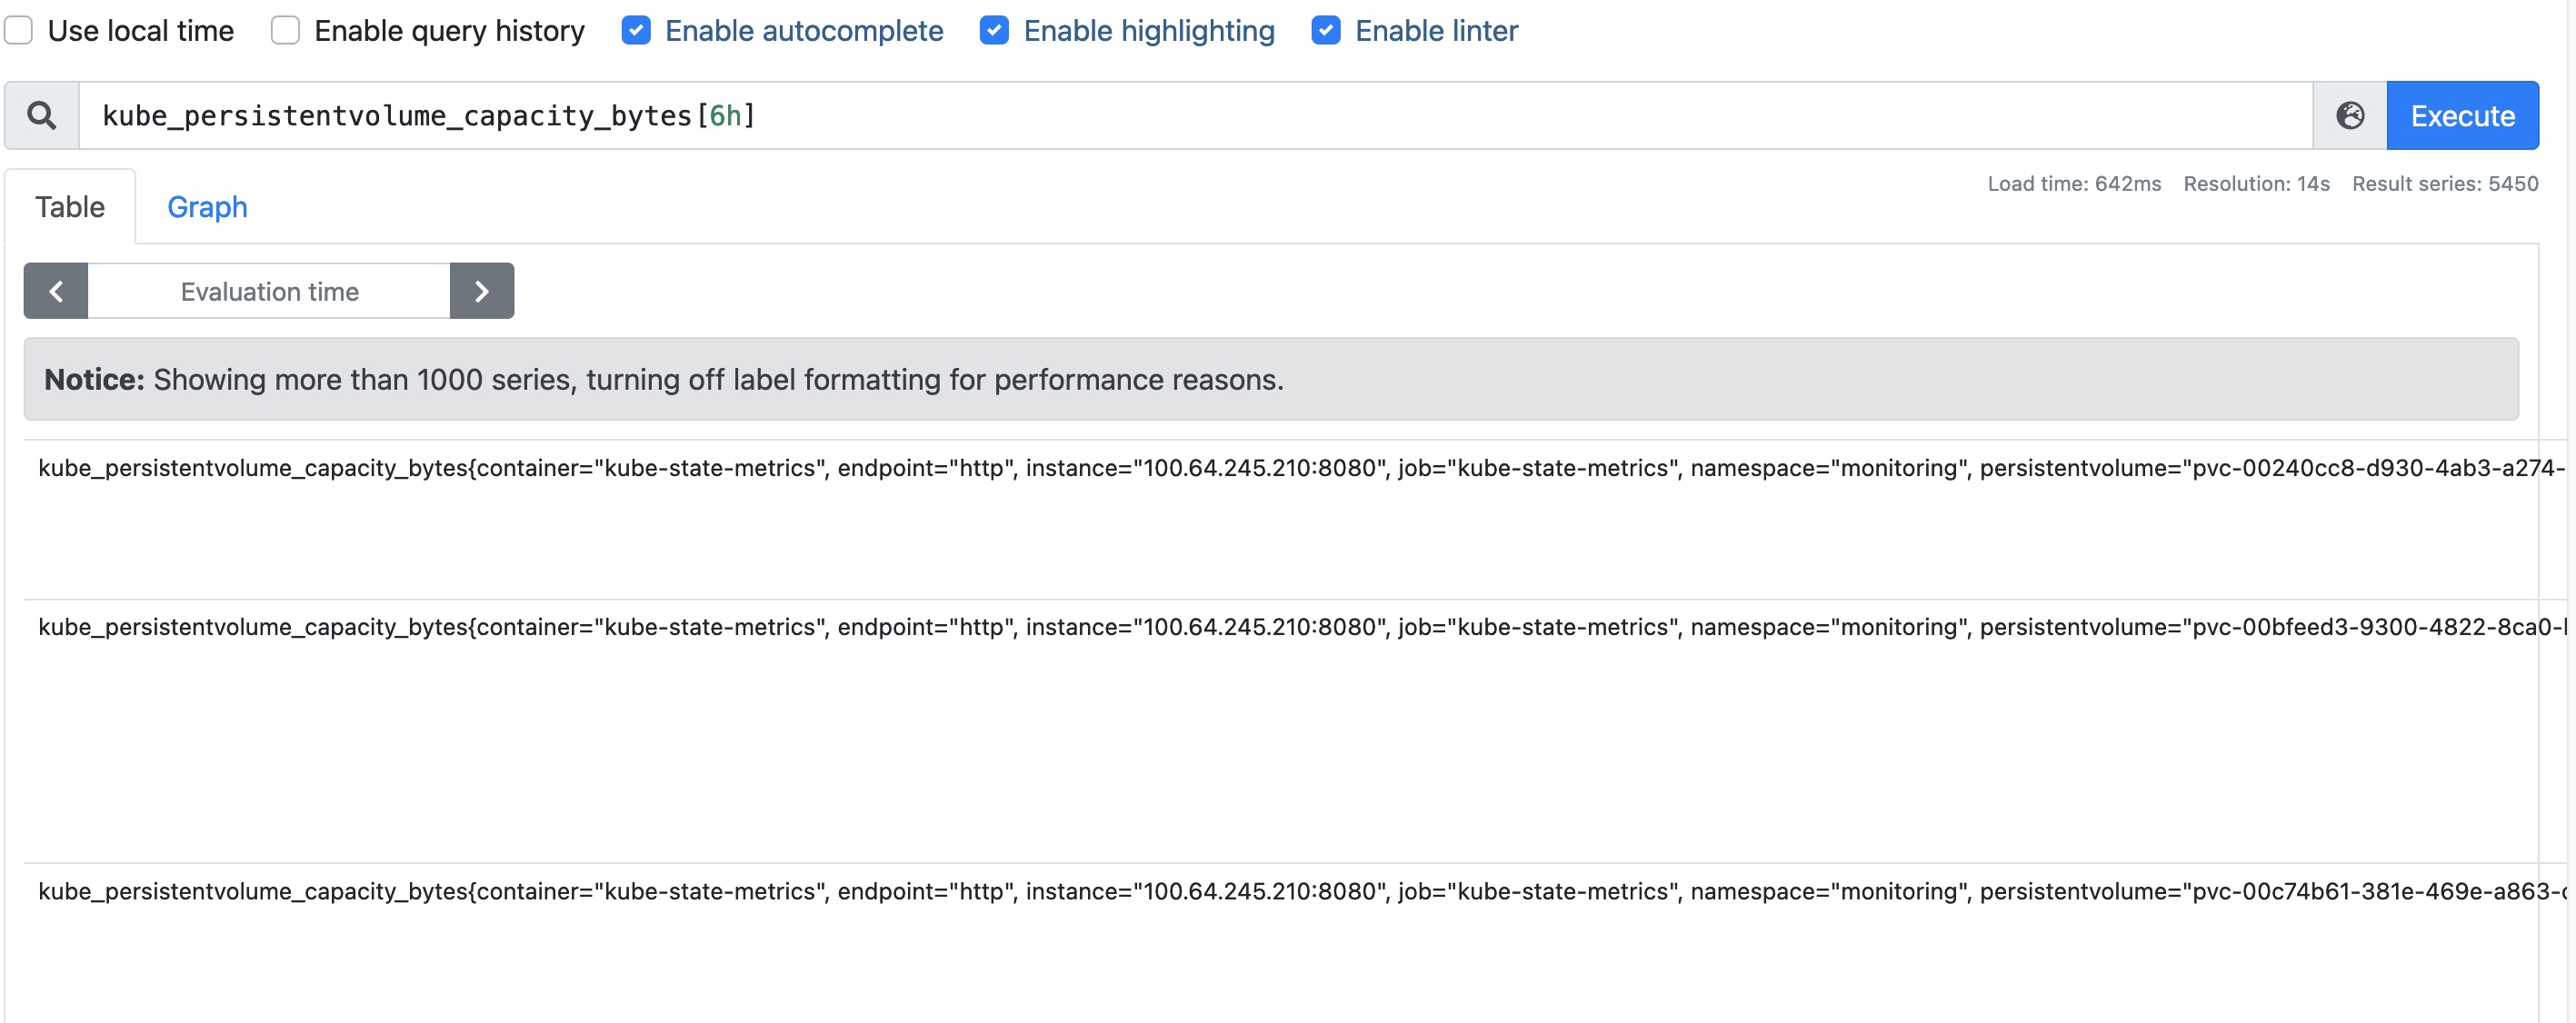
Current memory usage of the go process in the cost-model container. ```sh Mem: 12273012K used, 3931900K free, 1892K shrd, 37396K buff, 7457160K cached CPU: 18% usr 6% sys 0% nic...
Hi @mbolt35 , The first Picture was the memory usage with version v1.91.0 and now with the latest v1.91.2. With the latest release is the memory usage quite better, but...
HI @mbolt35 > What I would like to understand is the first image you posted which shows cost-model running at 99MiB compared to what looks like cost-model running at 120GiB....
Hi @kbrwn , Thanks for the Update and we will try it out. The link is not working, but i think you mean release v1.92.0-rc.0.