tidyCDISC
 tidyCDISC copied to clipboard
Demo the app here: https://bit.ly/tidyCDISC_app

This could be accomplished by various routes, but one thing to keep in mind is the gt helper package likely called tgen is under early development and promises to do...
When selecting `ADSL` data to filter, `AEACN` is an option and has values to filter on, but as soon as you "Apply Filters", `AEACN` has no values. It only filters...
The idea is to make this function more user friendly so it can be used outside of the app easily. [Here](https://github.biogen.com/biometrics/SEER/blob/542d92fb90168749aa45e716498439c27f26a9ba/R/mod_tableGen.R#L842) is the section of code I'm talking about... which...
Specifically, looking to get freqs of ANRIND for each paramcd. 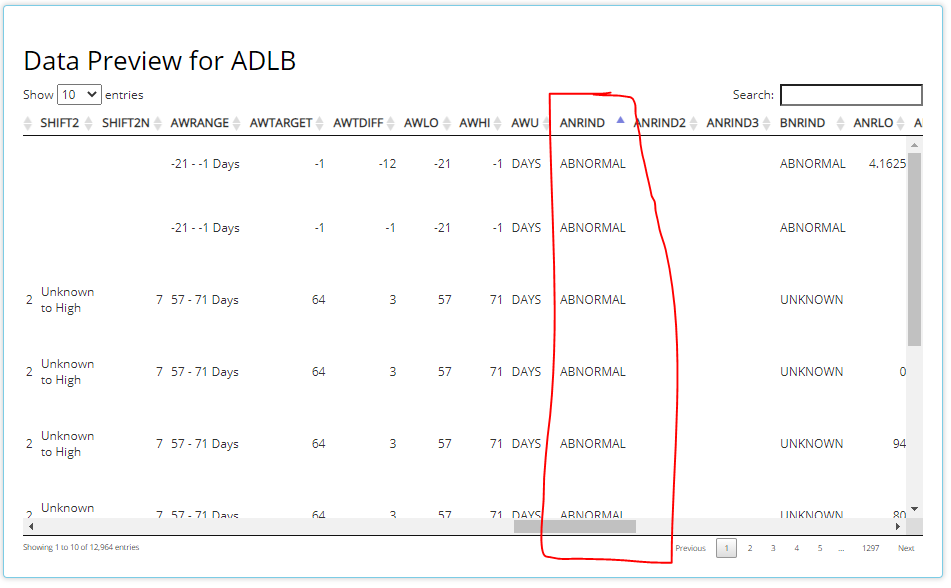 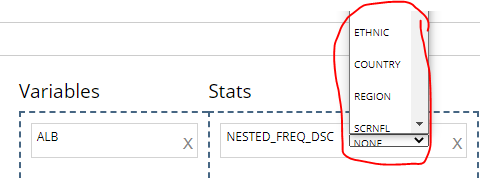
Raincloud plots would look much nicer than the plotted points we're showing right now. https://www.cedricscherer.com/2021/06/06/visualizing-distributions-with-raincloud-plots-with-ggplot2/ 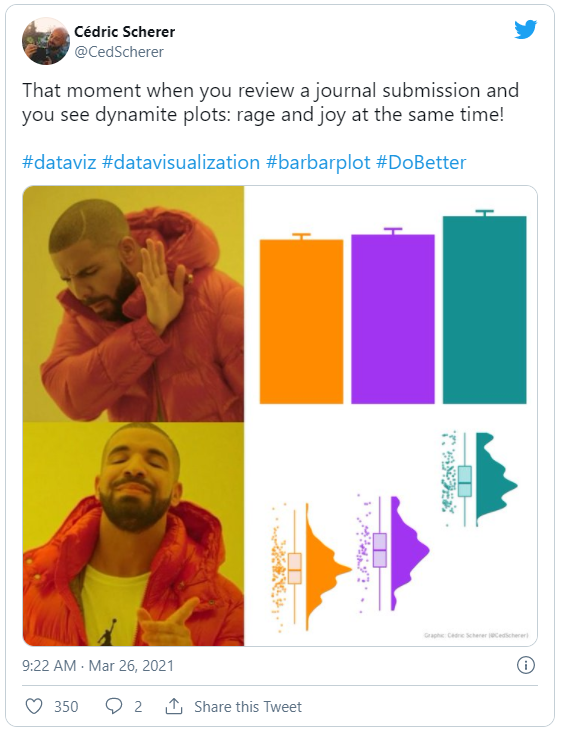
Would be nice to produce something like this for users: 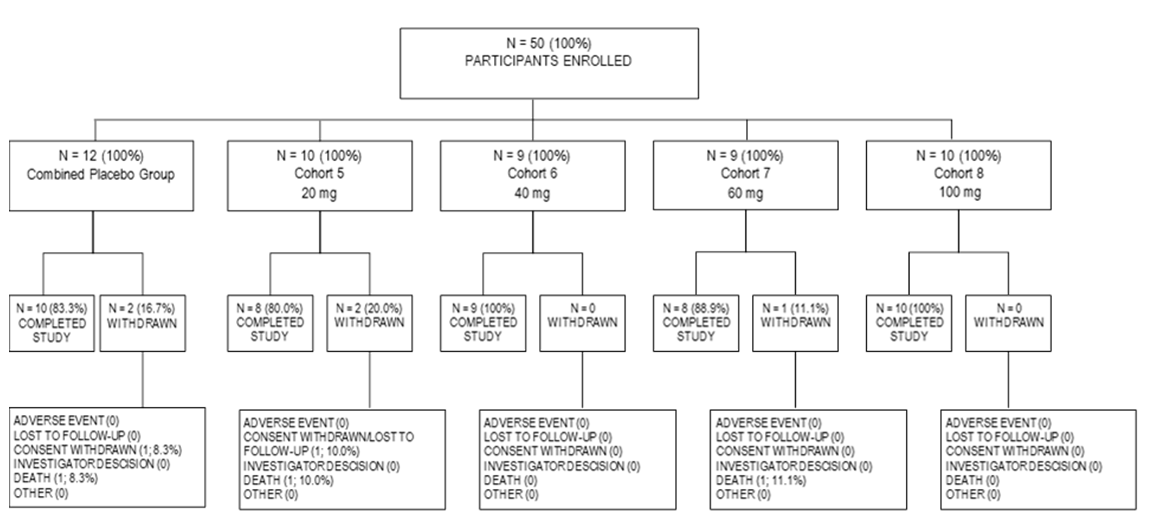 `diagrammeR` should be considered, but even more so, I think a sankey plot would be visually appealing: https://www.r-graph-gallery.com/323-sankey-diagram-with-the-networkd3-library.html 
There are a number of standard analysis tables that are low hanging fruit and could likely be added right now. For example, Table 18: AE summary and how to handle...
(a) Each subject counted once at maximum {VAR}.
Metadata
Owner
Metadata
Demo the app here: https://bit.ly/tidyCDISC_app