plottable
 plottable copied to clipboard
most pretty & lovely tables with matplotlib

# Line Plots/Sparklines in Cells  Hi @znstrider, thank you for publishing this awesome package🔥. This PR proposes to add the functionality to create line charts in cells. ## Summary...
Hi there! Thank you for this tremendous library I've been searching for a long time. I would like to propose adding the boxplot functionality in `plottable`. Without a lot of...
I want to change some rows height, it seems all rows are the same height.
Plottable is a Python library that I have had a great experience using, and I have a specific request for its development. When creating tables, I would like for negative...
This repository is really useful, and if it has this feature, it would be perfect.
First of all, thanks for building this awesome lib 🙏 It would be awesome to have a sparkling option to show the evolution of a group. Hope I did not...
For the [plot examples](https://plottable.readthedocs.io/en/latest/example_notebooks/plot_example.html), if I create a `Figure` instance with `layout='constrained'`, then the cell plots will not in the right cell as follows: ``` fig, ax = plt.subplots(figsize=(6, 10),...
 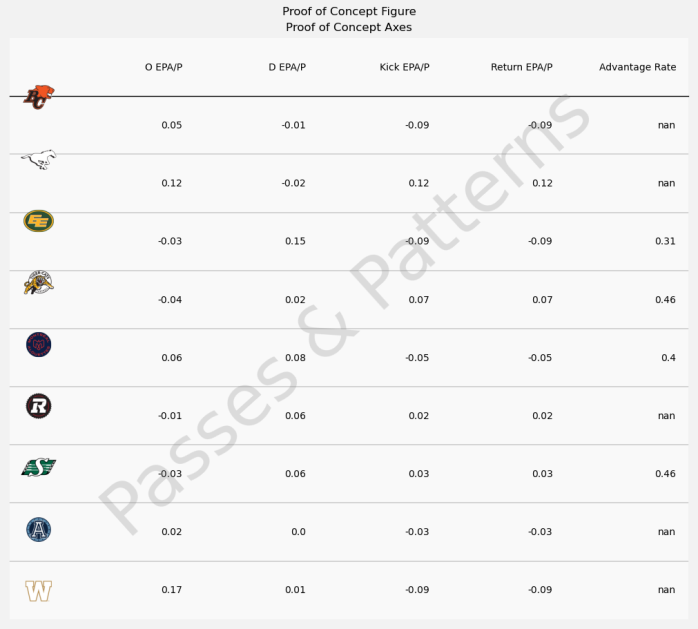 When a fig.suptitle or ax.set_title is used it throws off the vertical alignment of an image column. When both are used the effect is ~doubled. The bottom column...
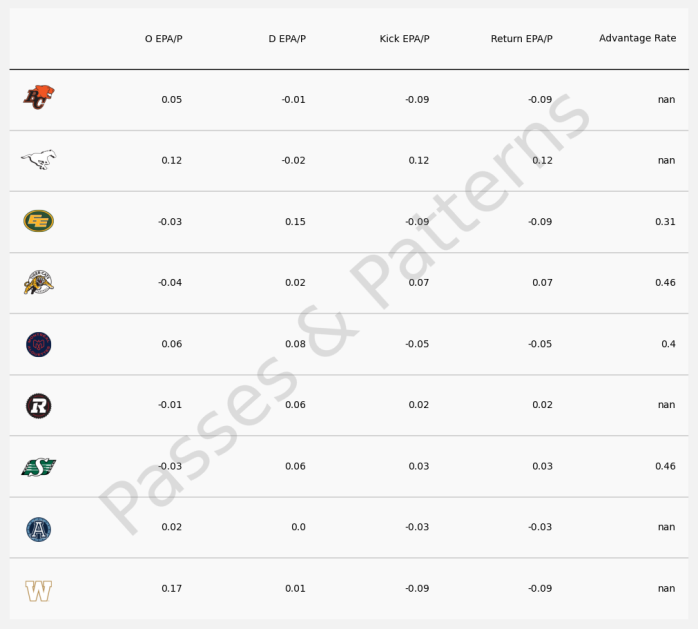
Using formatter decimal_to_percent doesn't allow nans. Ex. if I have a column showing an average and for some row there's simply no data it would have numpy.nan, the text formatter...
I changed the ColumnDefinition for one column on the wwc example, from: + [ ColumnDefinition( name=knockout_stage_cols[0], title=knockout_stage_cols[0].replace(" ", "\n", 1), formatter=decimal_to_percent, cmap=cmap, group="Knockout Stage Chances", border="left", ) ] to: +...