tidytuesday
 tidytuesday copied to clipboard
Published
20 hours ago •
 zhiiiyang
:bar_chart: :paintbrush: Data visualization collection
 Data Visualization Gallery
Twitter :speech_balloon: | LinkedIn :necktie: | GitHub :octocat: | Website :link:
Table of Contents (click to expand)
-
How to make an interactive treemap using
treemapandd3treeR -
How to make an geofacet waffle chart using
geofacet -
How to make a map using
geofacet -
How to make an animated picture using
gganimate -
How to make a heatmap of your Twitter activity using
ggplot2 -
How to make a radar/spider plot of your tweet frequency using
ggplot2 -
How to make a heatmap using
ggplot2andreticulate -
How to make a Sankey diagram and a Word Cloud using
networkD3andwordcloud2
How to make an interactive treemap using treemap and d3treeR

Data: introduction of #TidyTuesday media franchise data here
Code: click here
Note: to interact with the treemaps, please go to the post
How to make an geofacet waffle chart using geofacet


Data: introduction of #TidyTuesday school diversity data here
Code: click here
Note: go to andriy-gazin/geowaffle to see the original post
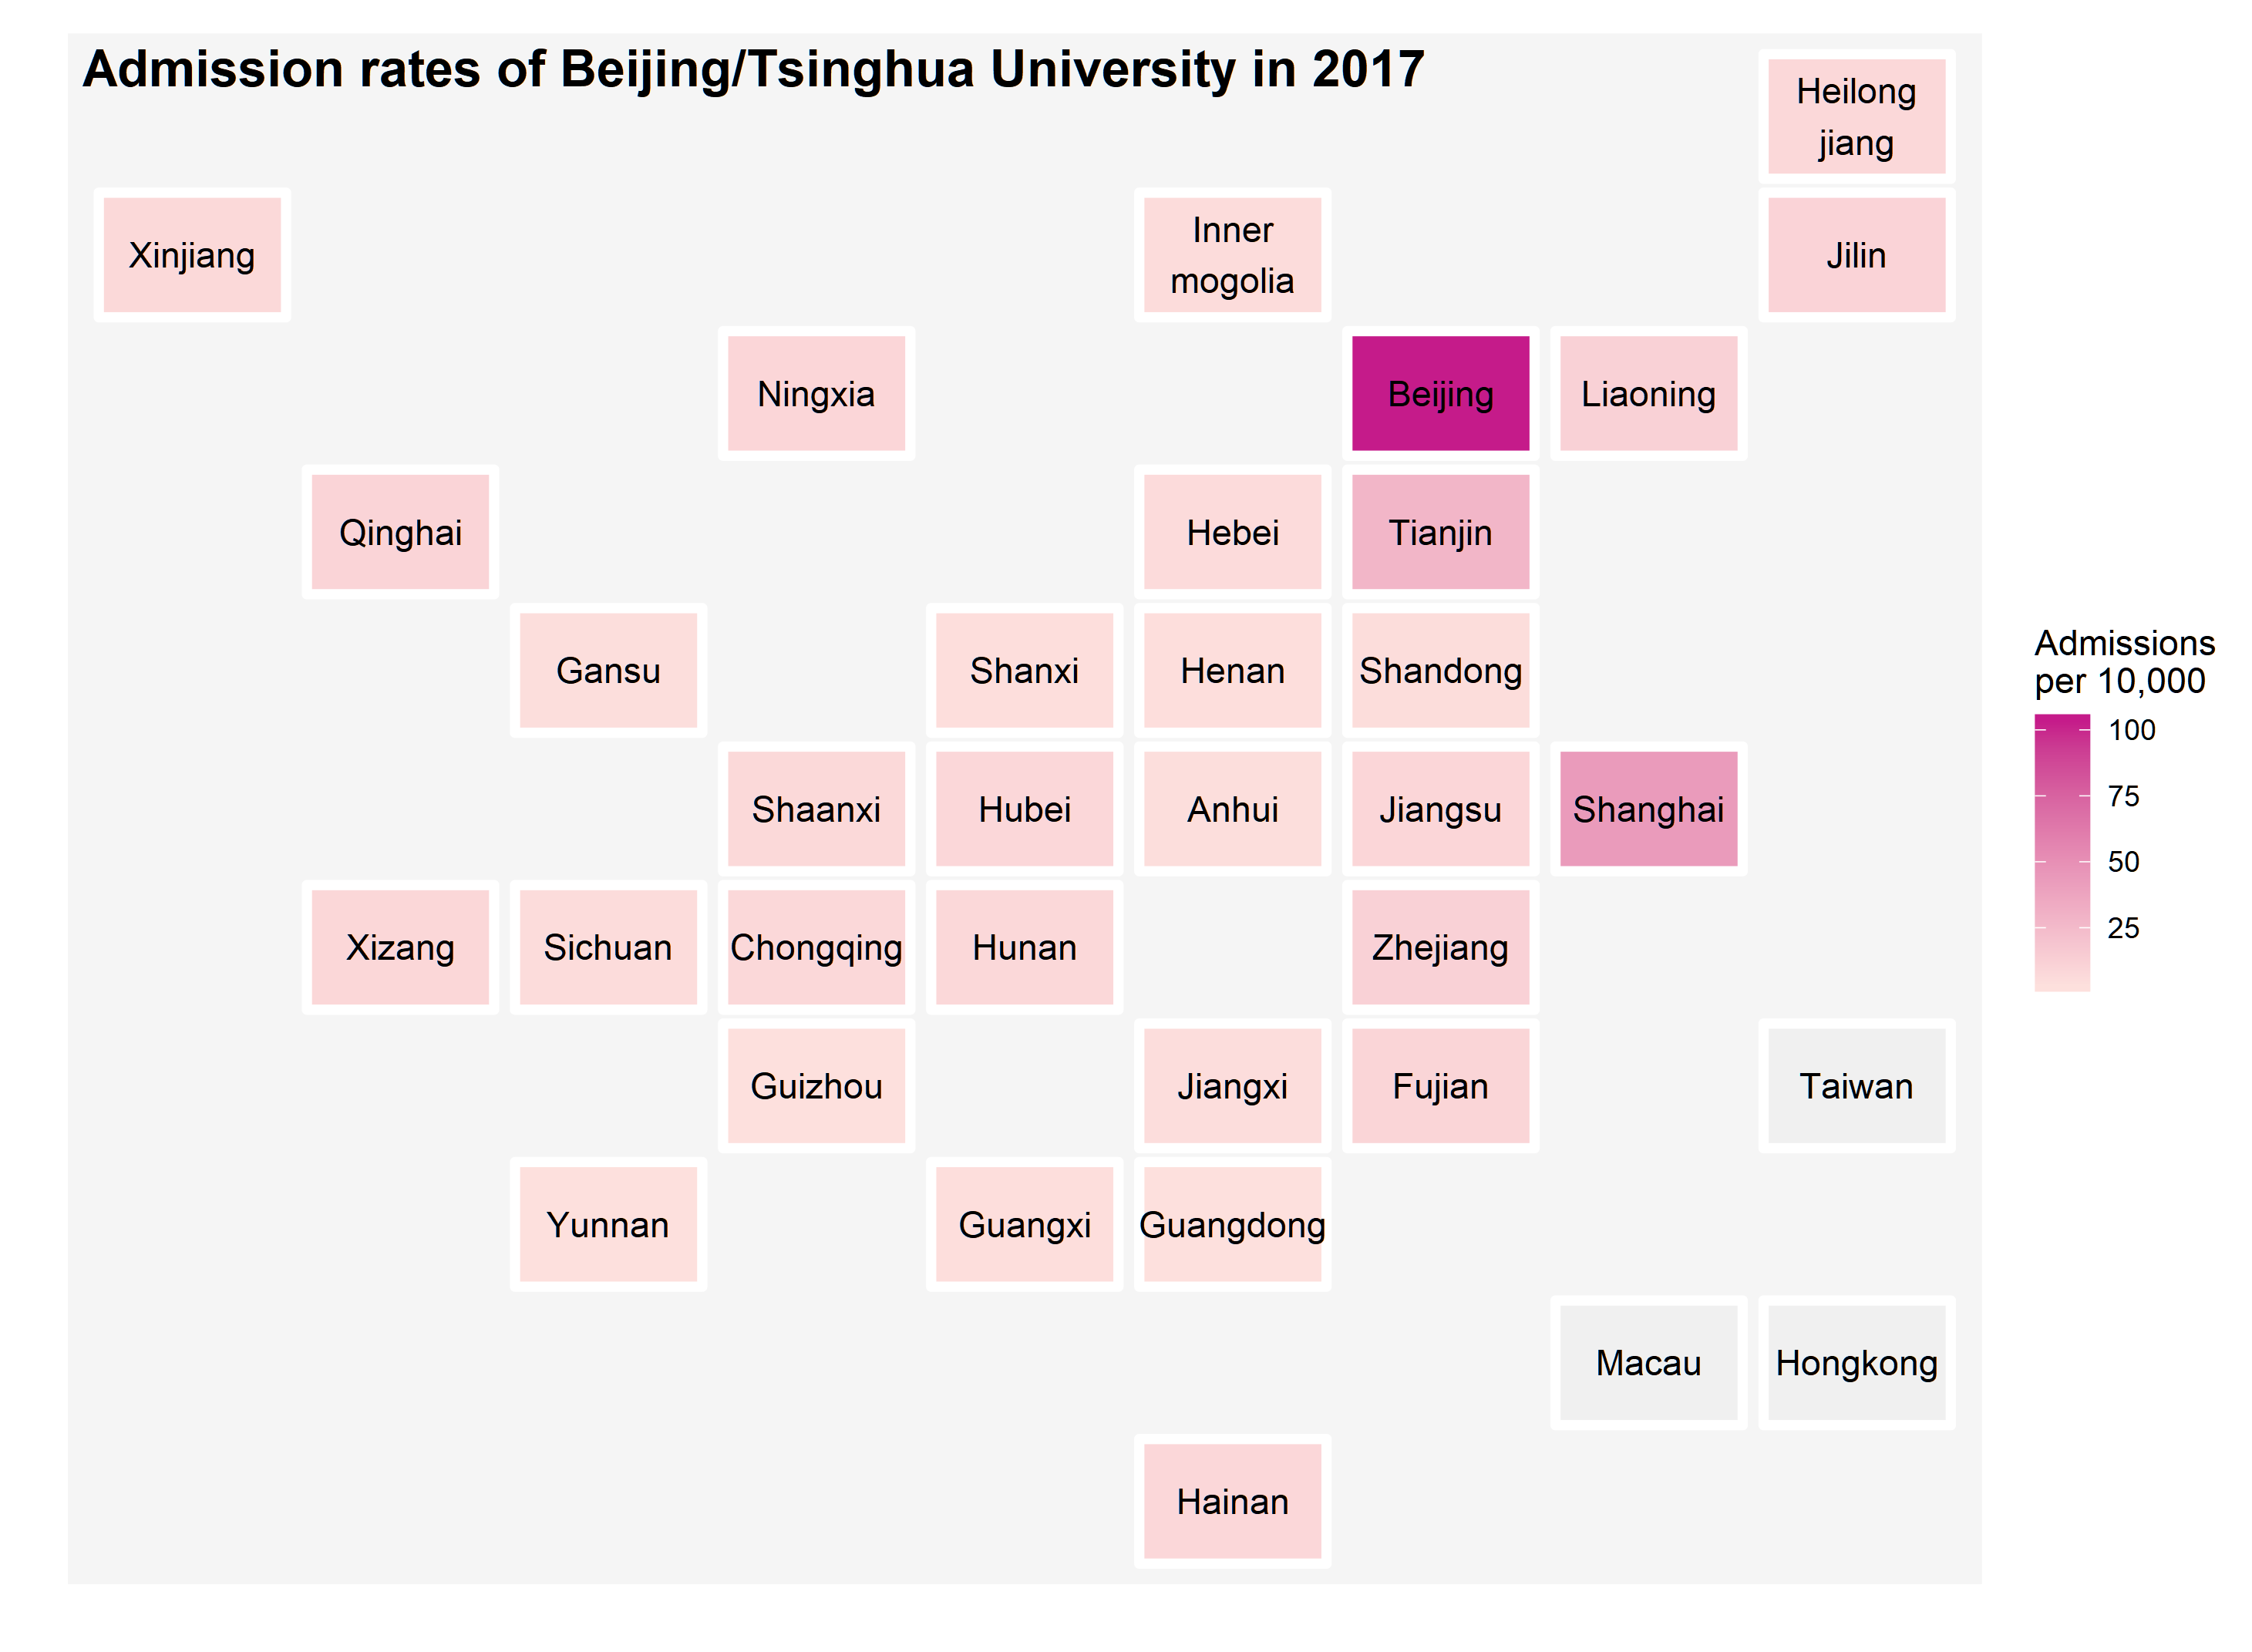
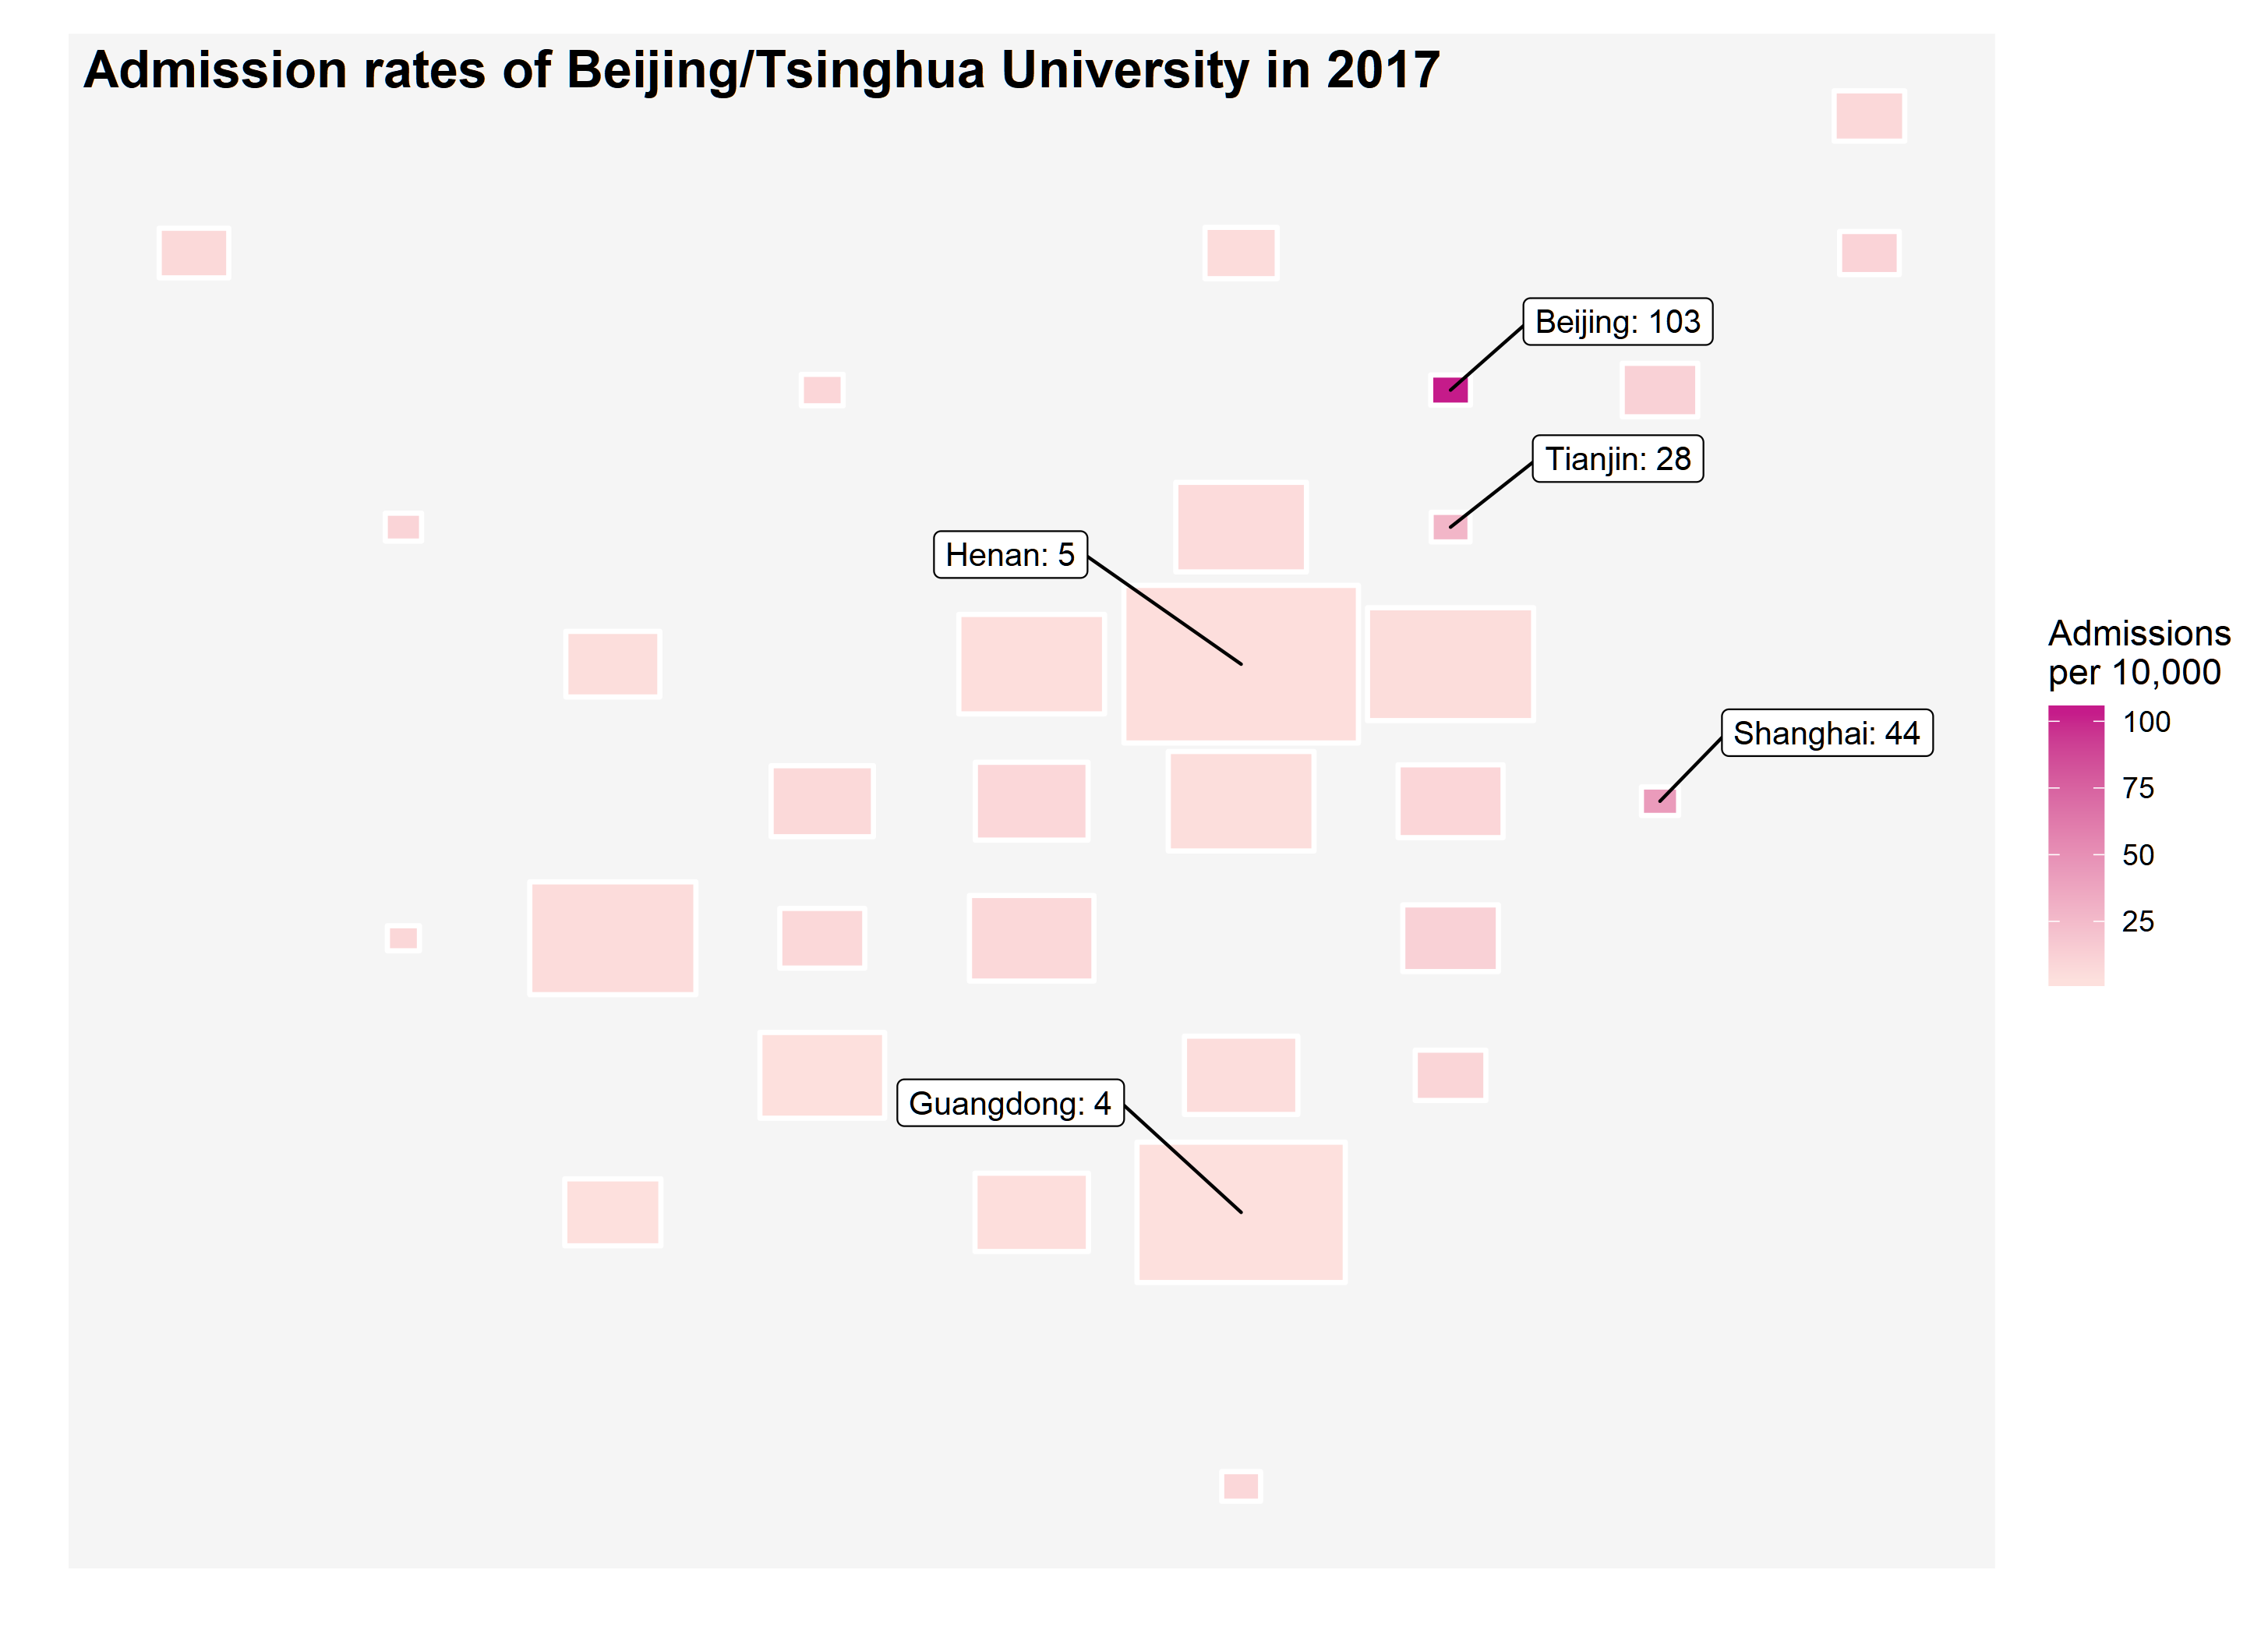
How to make a map using geofacet

How to make an animated picture using gganimate

Code: click here
How to make a heatmap of your Twitter activity using ggplot2

Code: click here
How to make a radar/spider plot of your tweet frequency using ggplot2

Code: click here
How to make a heatmap using ggplot2 and reticulate

Code: click here
Note: this work was inspired by the post on Reddit.
How to make a Sankey diagram and a Word Cloud using networkD3 and wordcloud2


Code: click here