AccuSleep

AccuSleep copied to clipboard
Adding pwelch and theta/delta plot
This pull request is in line with #6.
I have been able to create a separate view with the desired
It doesn't look gorgeous but it does the job. There's a little bit of a hit in terms of performance. I think it's due to my calling of plot instead of properly setting the axes and data.
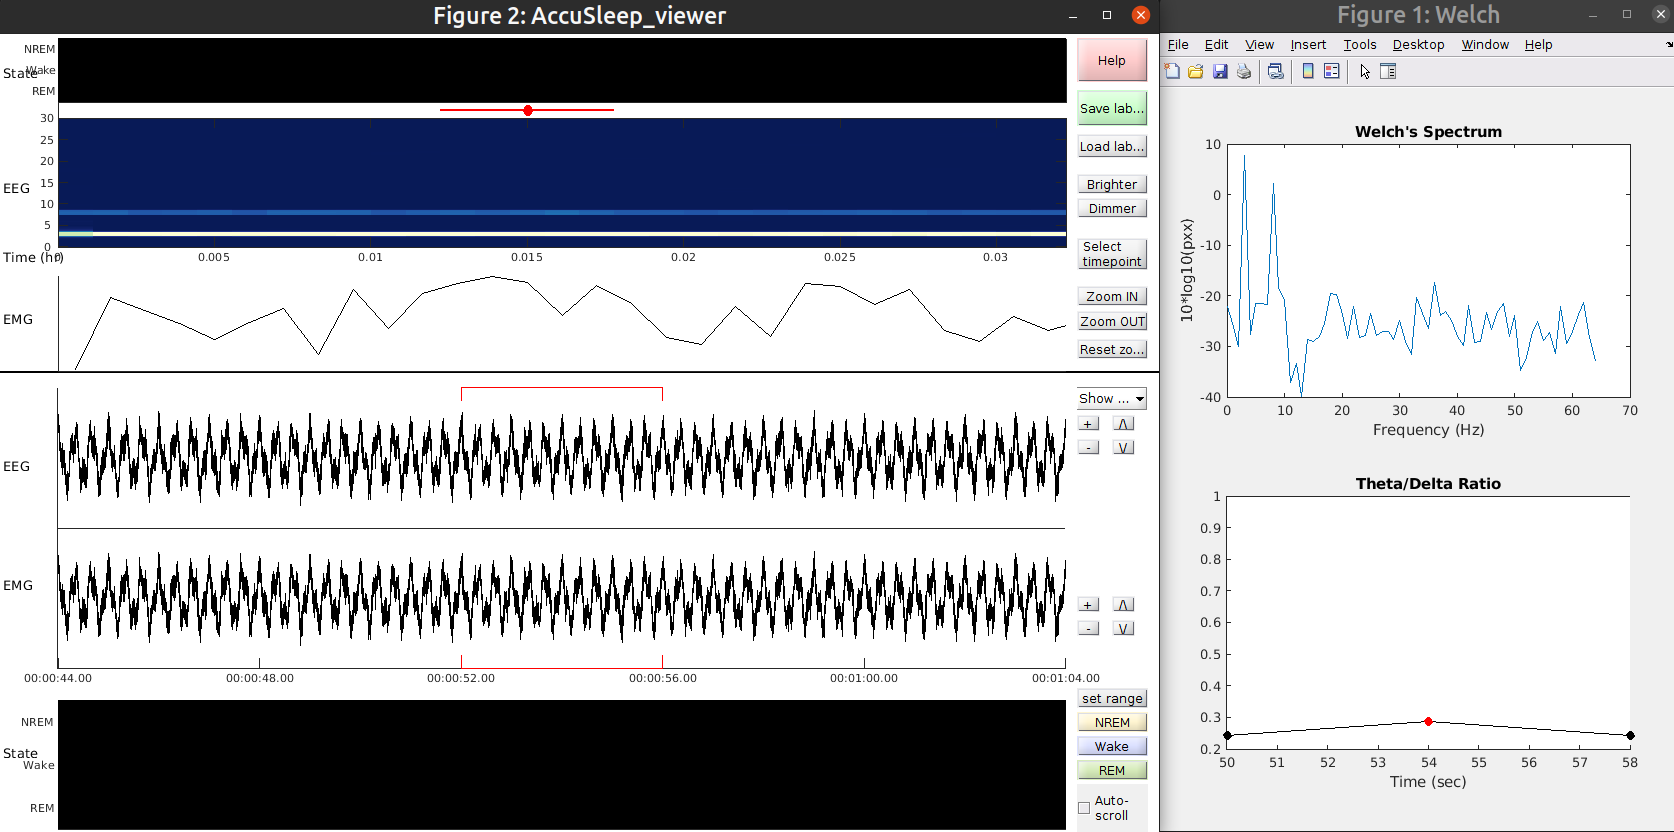
I also noticed that the first 3 and last 3 epochs produce the same welch spectrum, not sure if the indices I am using are correct or if the data is replicated for display purposes.
For completeness, here's the code I used to create the simulated signal shown in the screenshot.
fs =  1000;
step = 1/fs;
signal_seconds = 120;

t = 0:step:signal_seconds-step;
x = cos(2*pi*8*t) + 2 * cos(2*pi*3*t) + 0.5 * randn(size(t));
eeg = struct("EEG", x);
emg = struct("EMG", x);
save("eeg.mat", '-struct', 'eeg')
save("emg.mat", '-struct', 'emg')