30DayChartChallenge2021
 30DayChartChallenge2021 copied to clipboard
📊 My contributions to the #30DayChartChallenge 2021
#30DayChartChallenge 2021
![]()
![]()
![]()
![]()
![]()
![]()
![]()
My contributions to the first #30DayChartChallenge initiated by Dominic Roye and myself.
Have a look at community contributions to the first edition here or to all editions so far on our dedicated webpage.
List of All Contributions (click to expand)
- Comparisons
- Day 1: Part-to-Whole
- Day 2: Pictogram
- Day 3: Historical
- Day 4: Magical
- Day 5: Slope
- Day 6: Experimental
- Distributions
- Relationships
- Day 13: Correlation
- Day 14: Space
- Day 15: Multivariate
- Day 16: Trees
- Day 17: Pop Culture
- Day 18: Connections
- Timeseries
- Day 19: Global Change
- Day 20: Upwards
- Day 21: Downwards
- Day 22: Animation
- Day 23: Tiles
- Day 24: Monochrome
- Uncertainties:
- Day 25: Demographic
- Day 26: Trends
- Day 27: Educational
- Day 28: Future
- Day 29: Deviations
- Day 30: 3D
Comparisons
Day 1: Part-to-Whole
Tool: Microsoft PowerPoint
Day 2: Pictogram
Tool: Microsoft Word
Day 3: Historical
Tool: ggplot2
Day 4: Magical
Tool: ggplot2
Day 5: Slope
Tool: ggplot2
Day 6: Experimental
Tool: ggplot2
Distributions
Day 7: Physical
Tools: amcharts and Figma
Day 8: Animals
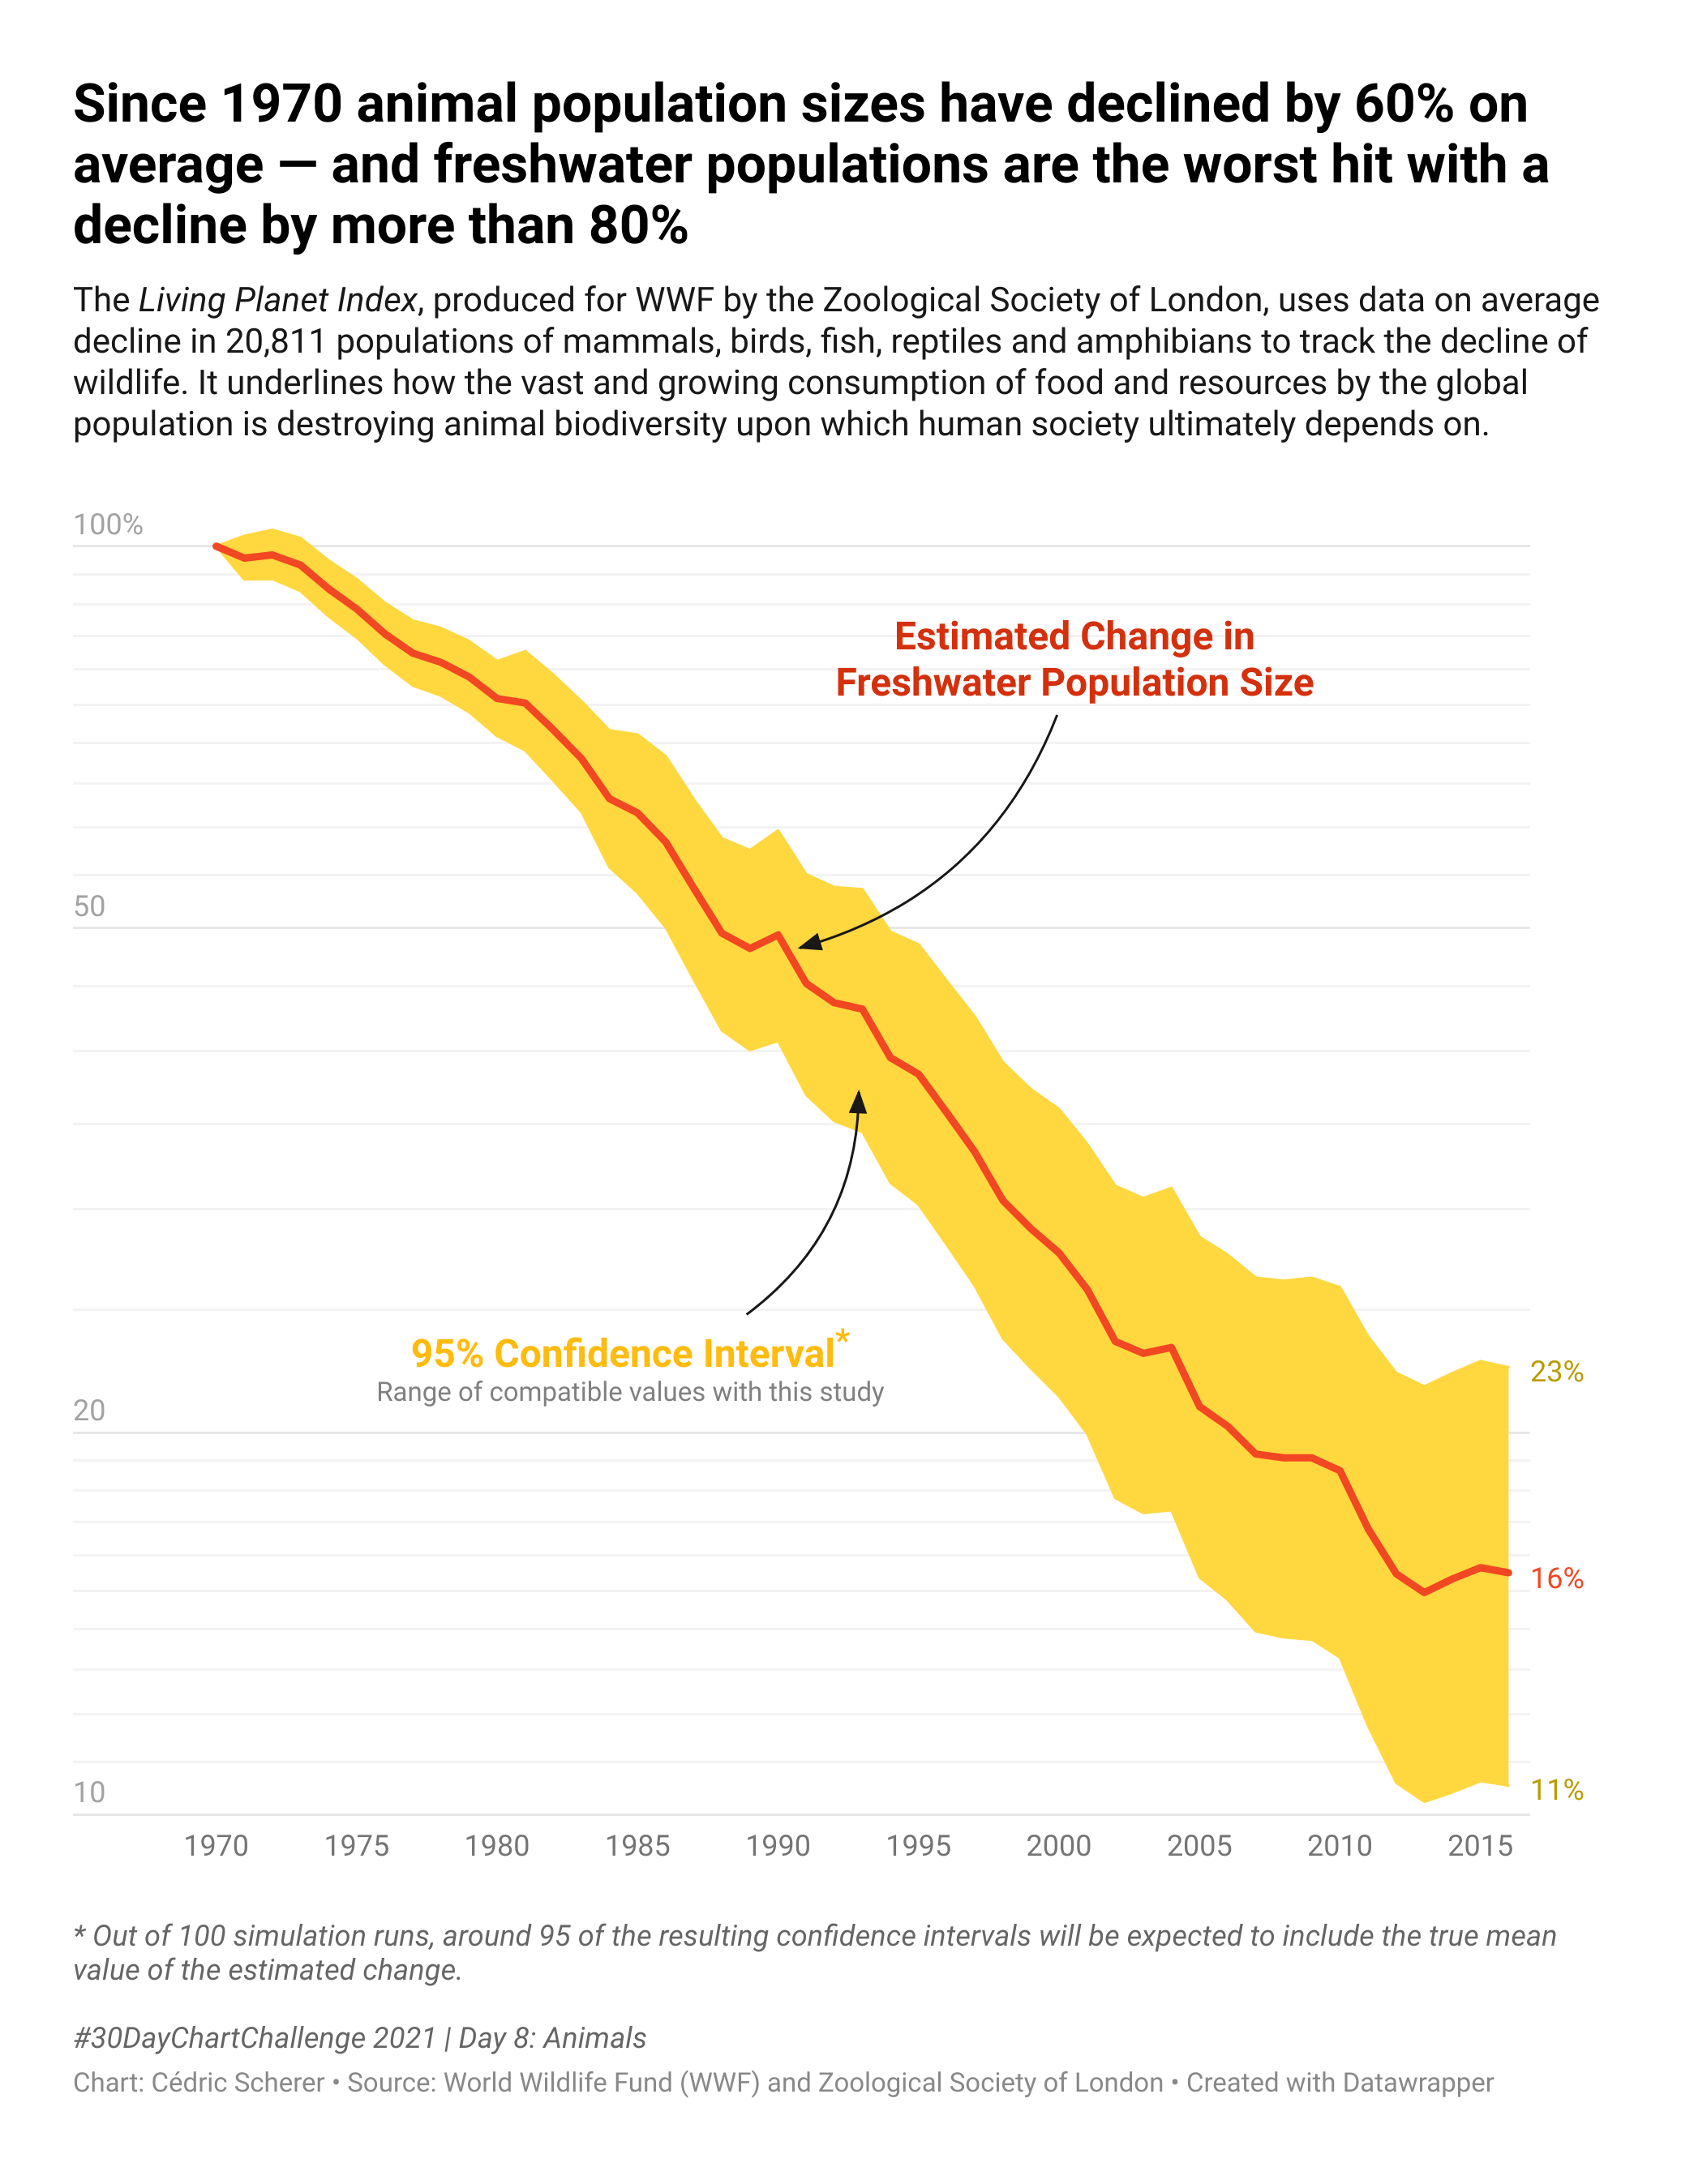
Tool: DataWrapper (Interactive version)
Day 10: Abstract
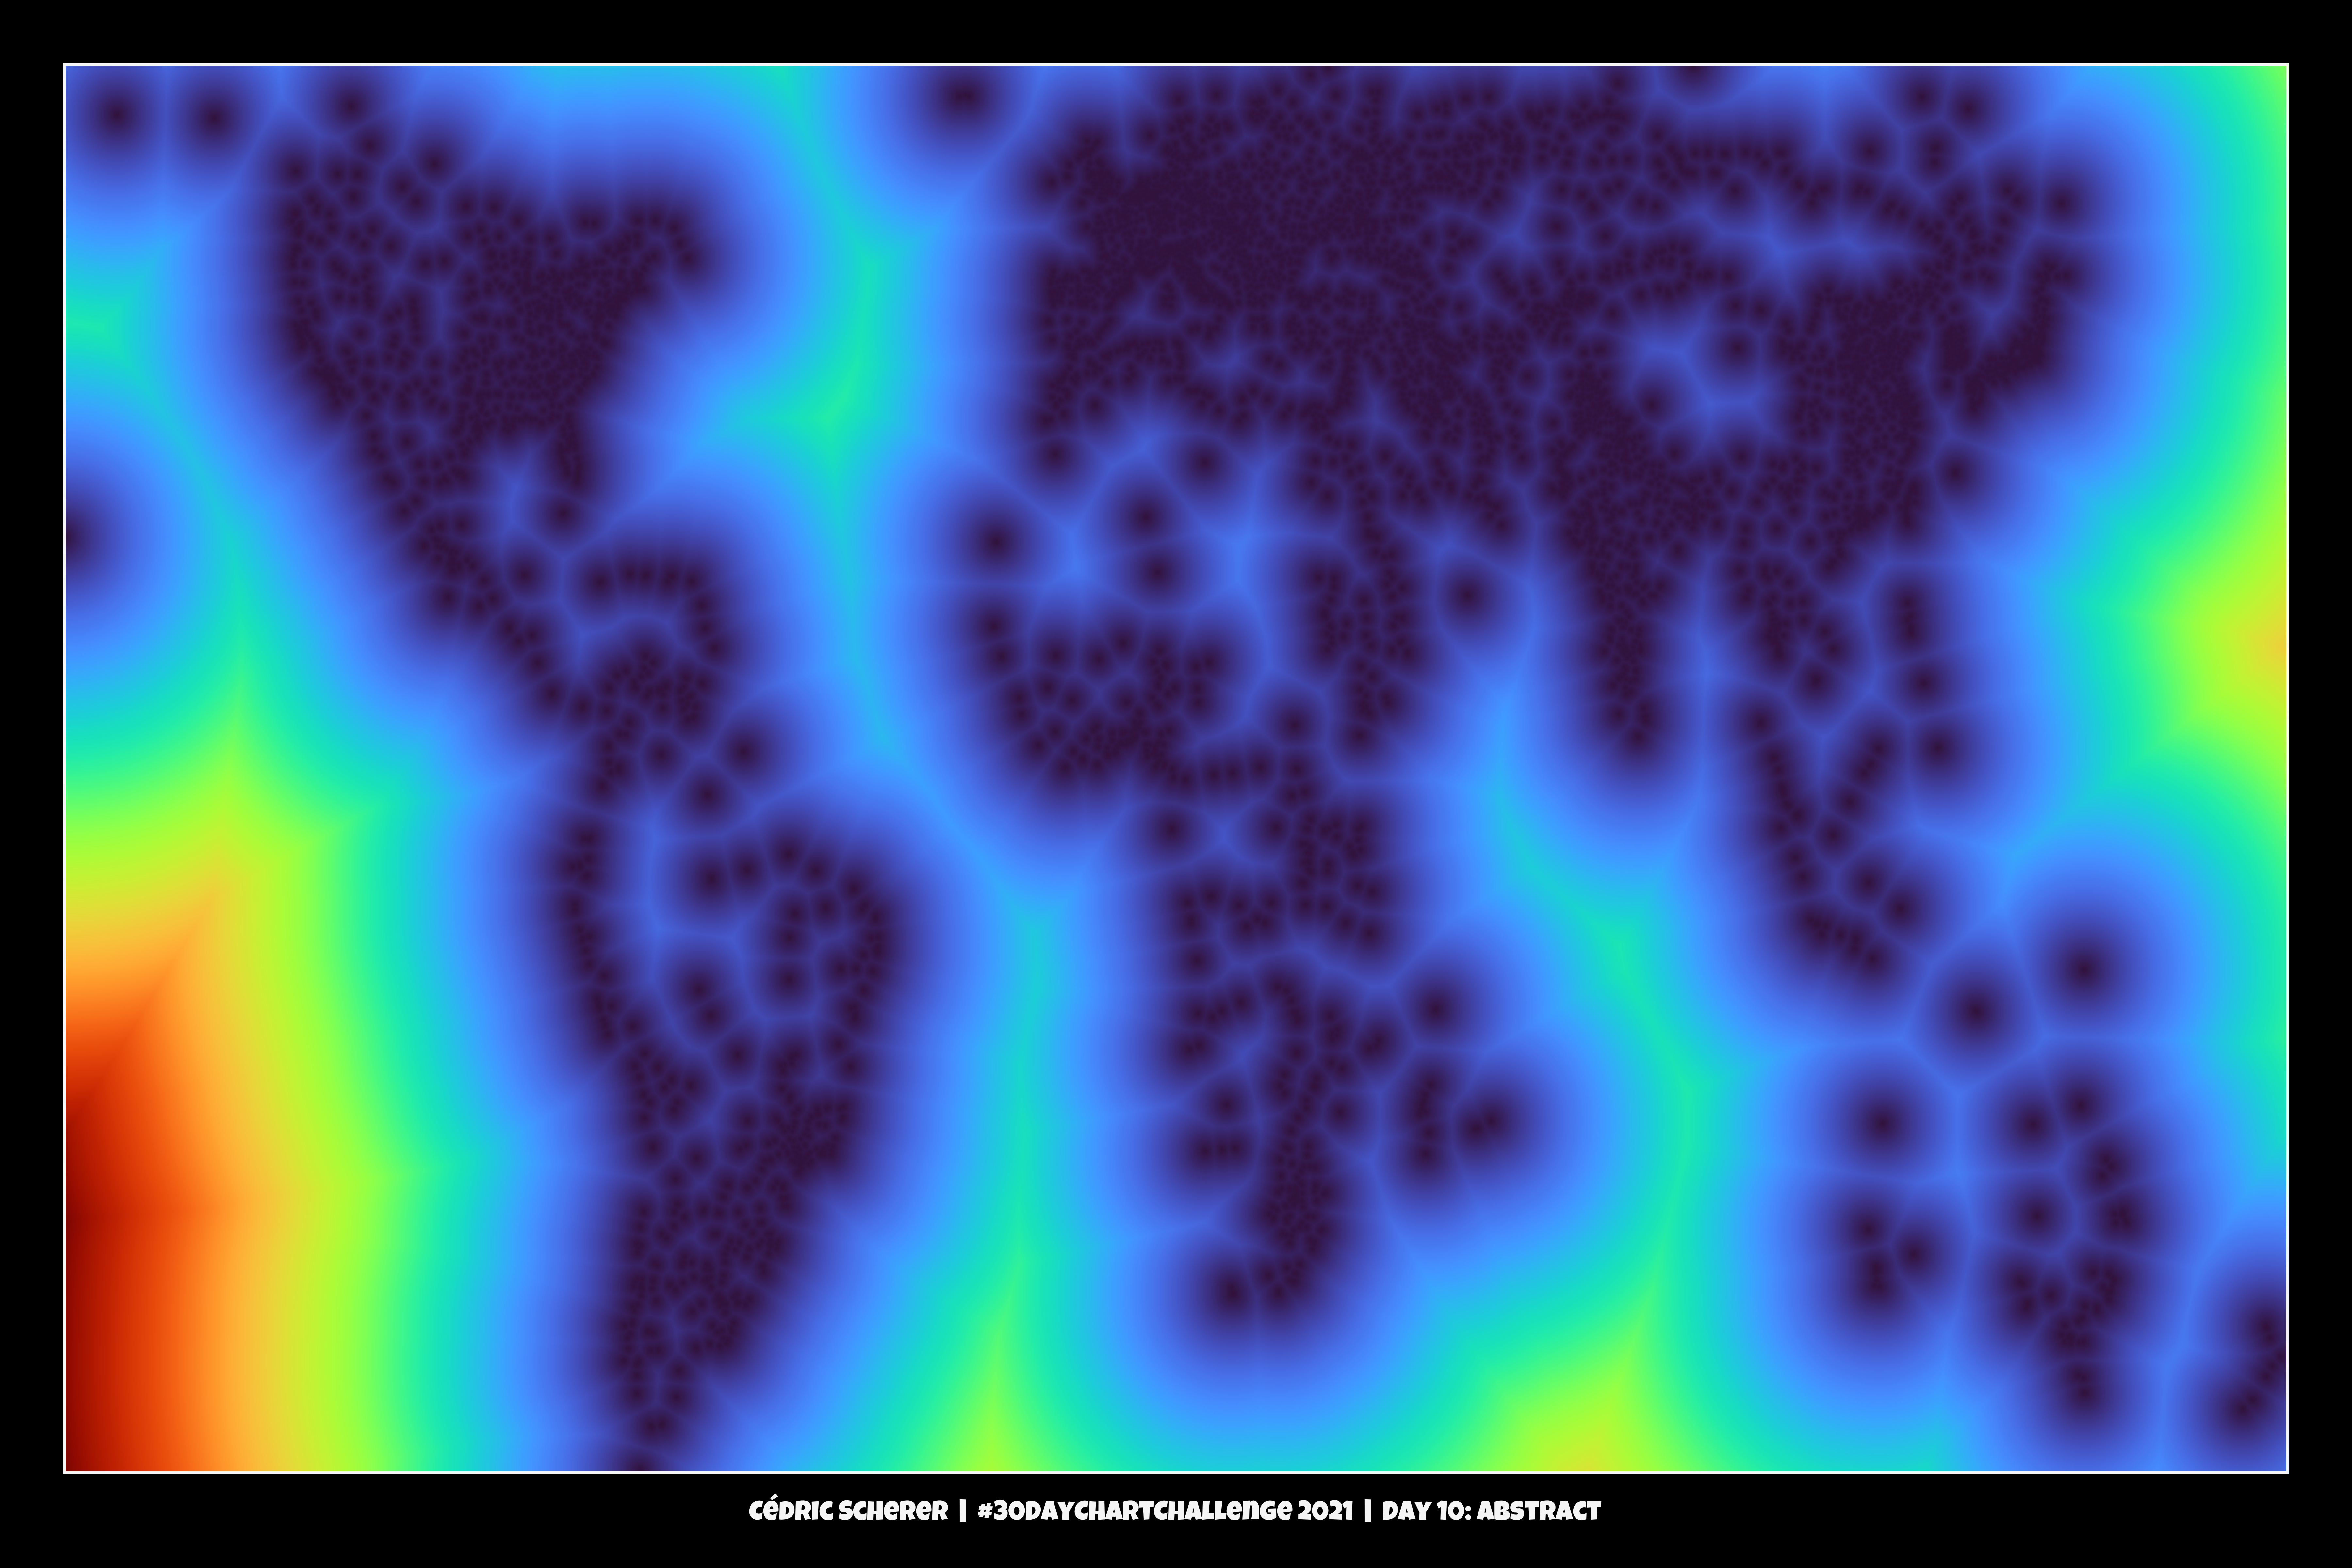
Tool: ggplot2
Relationships
Day 13: Correlation
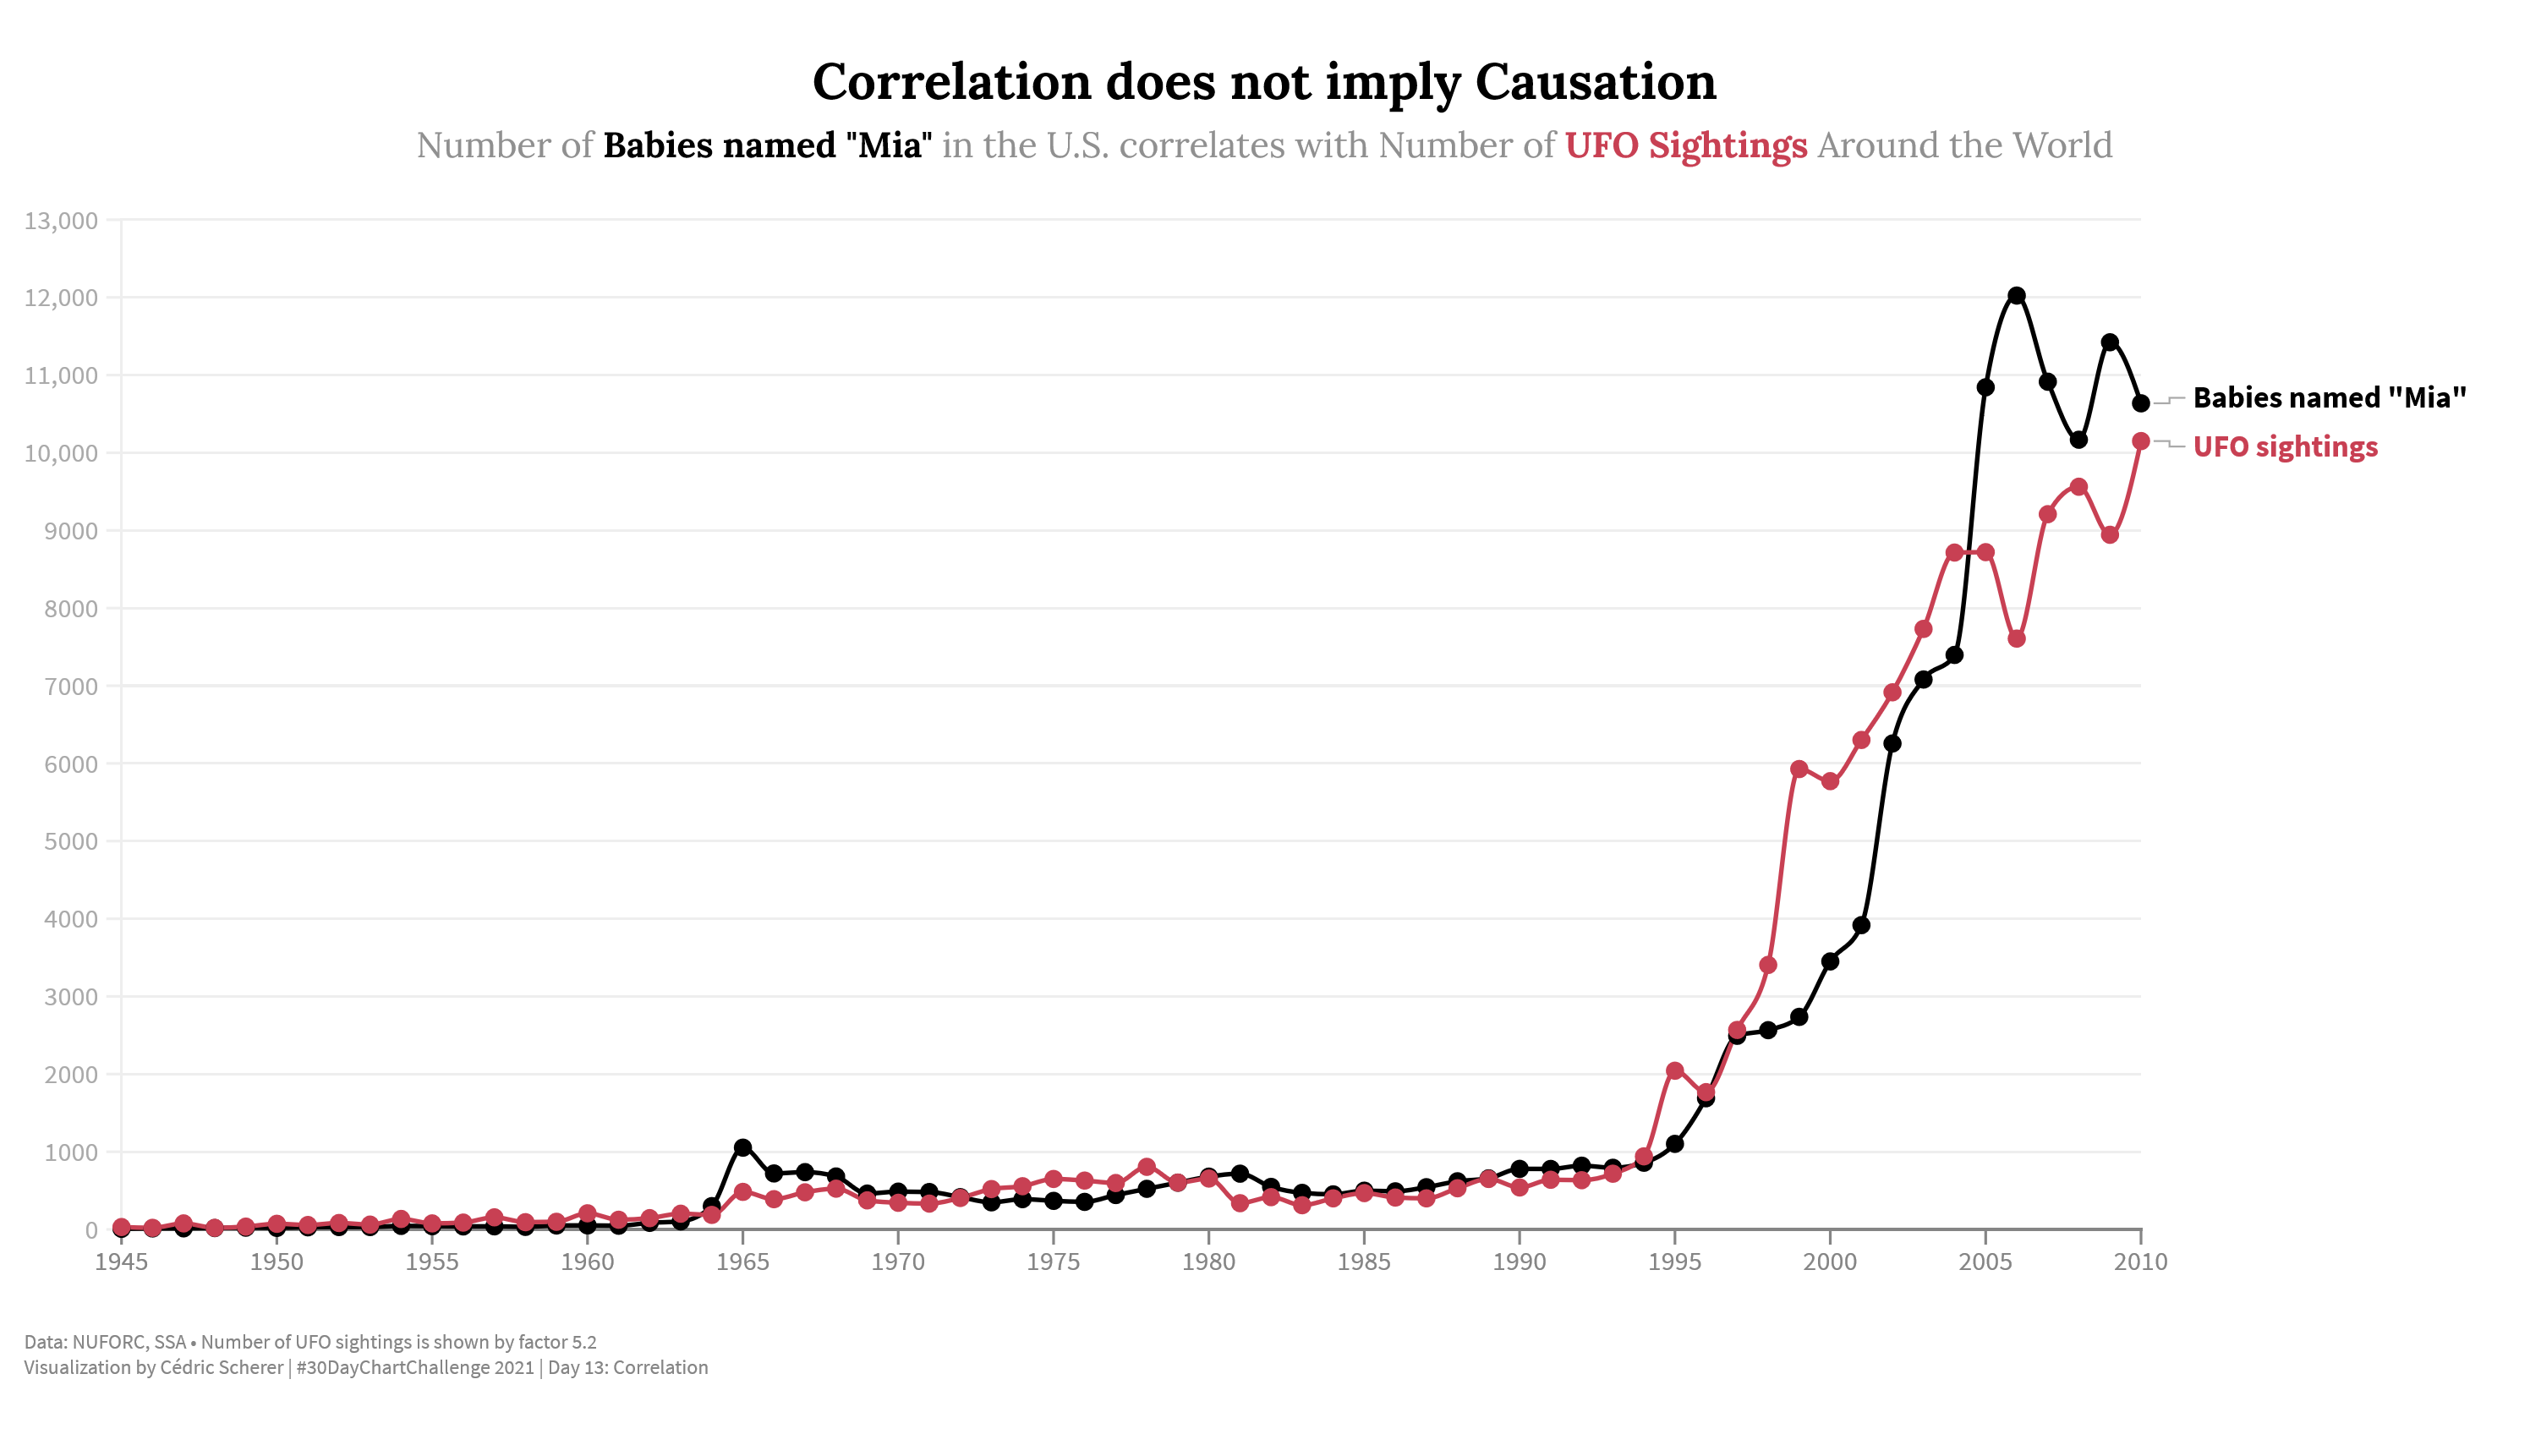
Tool: Flourish (Interactive version)
Day 14: Space
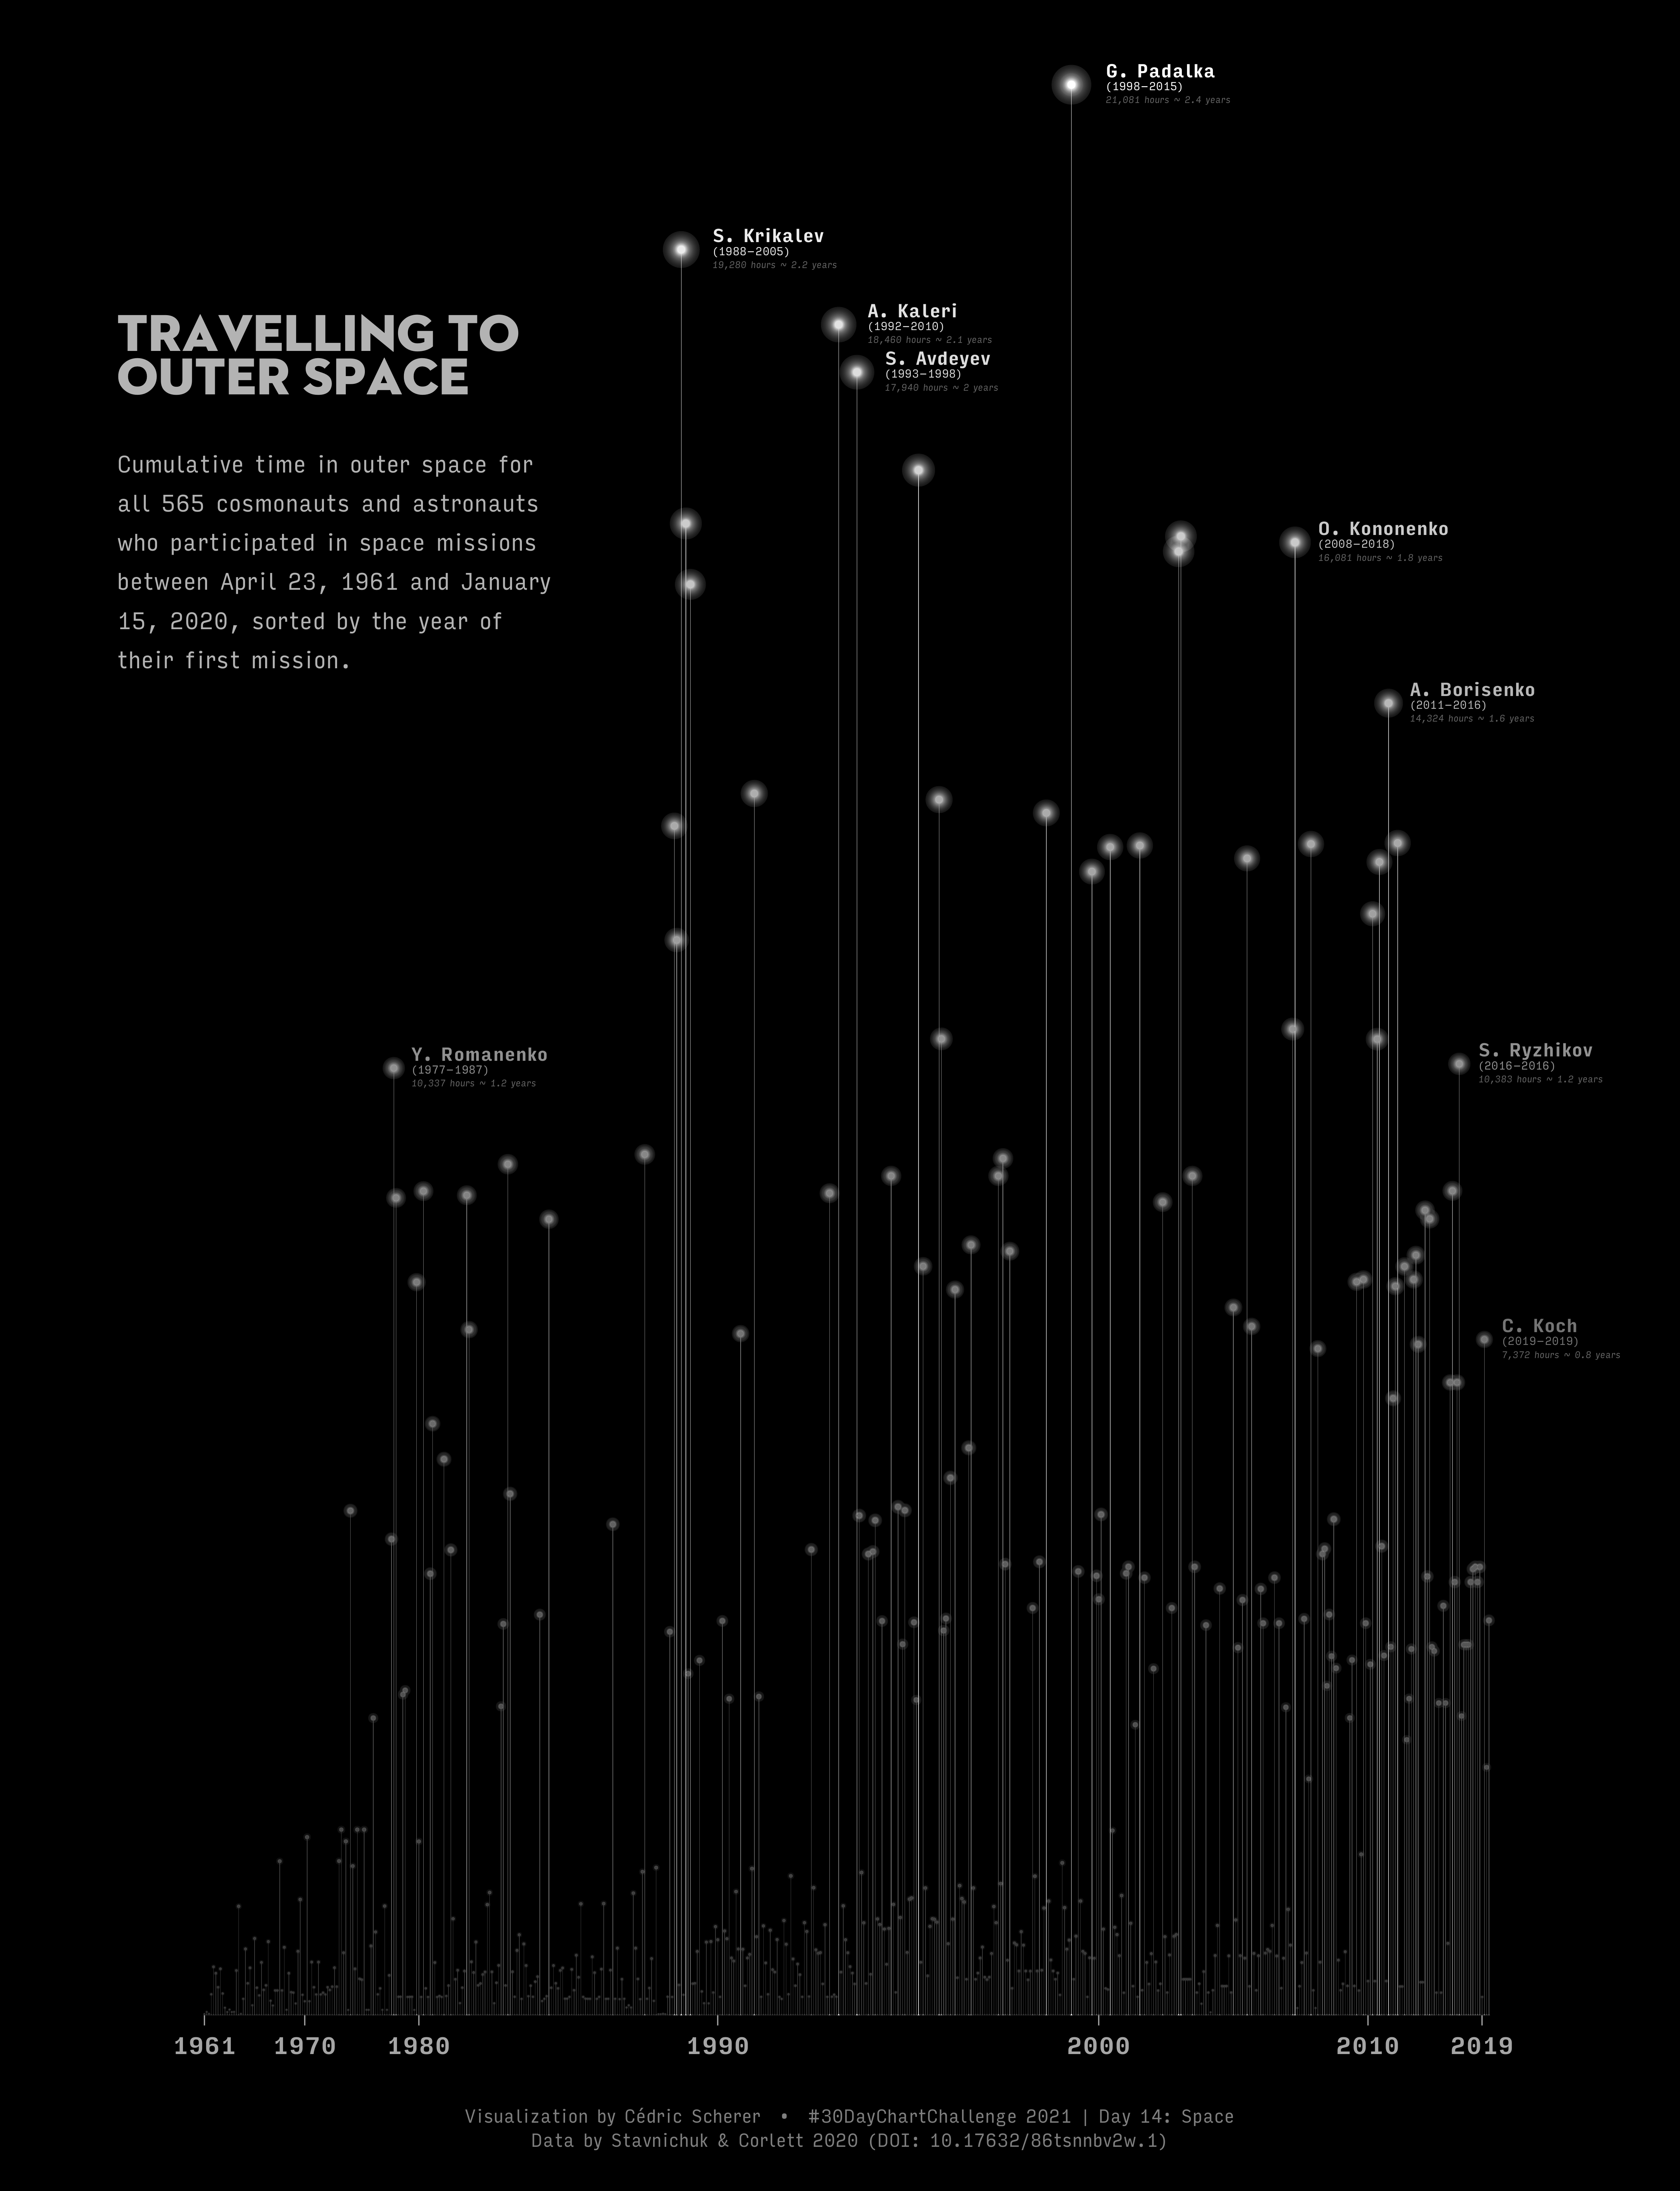
Tool: ggplot2
Day 16: Trees
Tool: ggplot2
Day 17: Pop Culture
Tool: ggplot2
Timeseries
Day 19: Global Change
Tools: ggplot2 and Figma
Day 20: Upwards
Tool: ggplot2
Day 21: Downwards
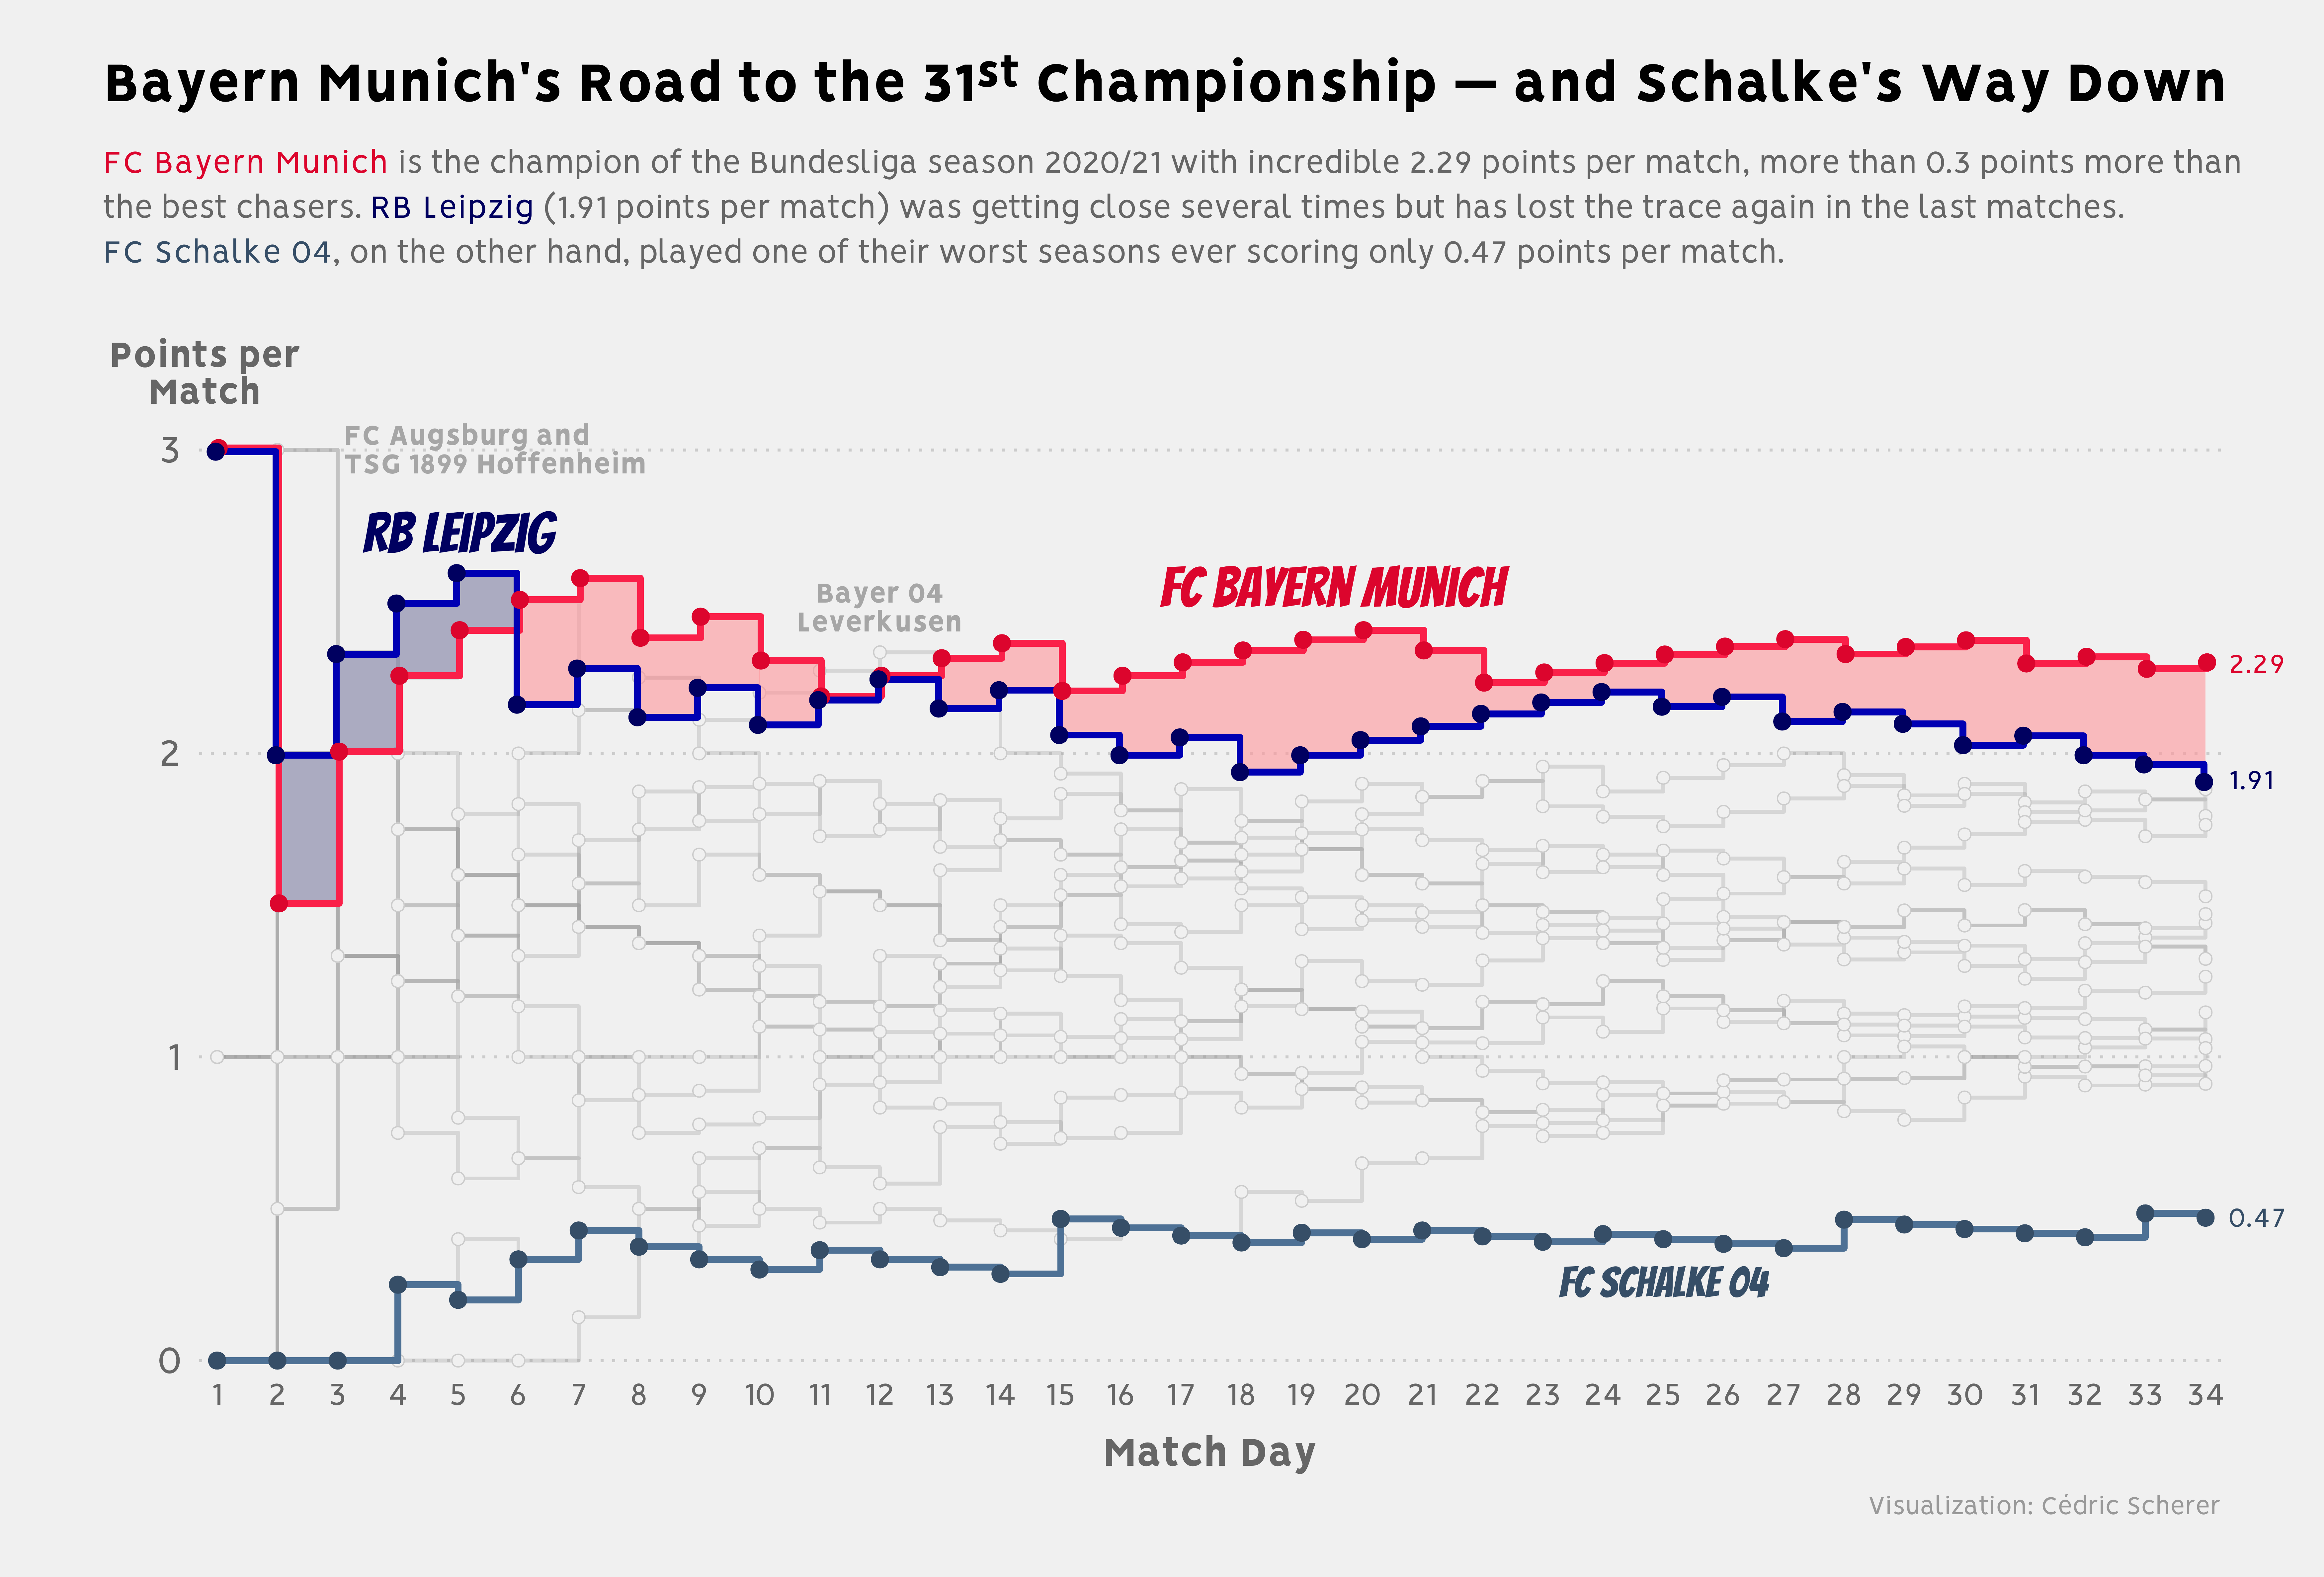
Tool: ggplot2
Day 22: Animation
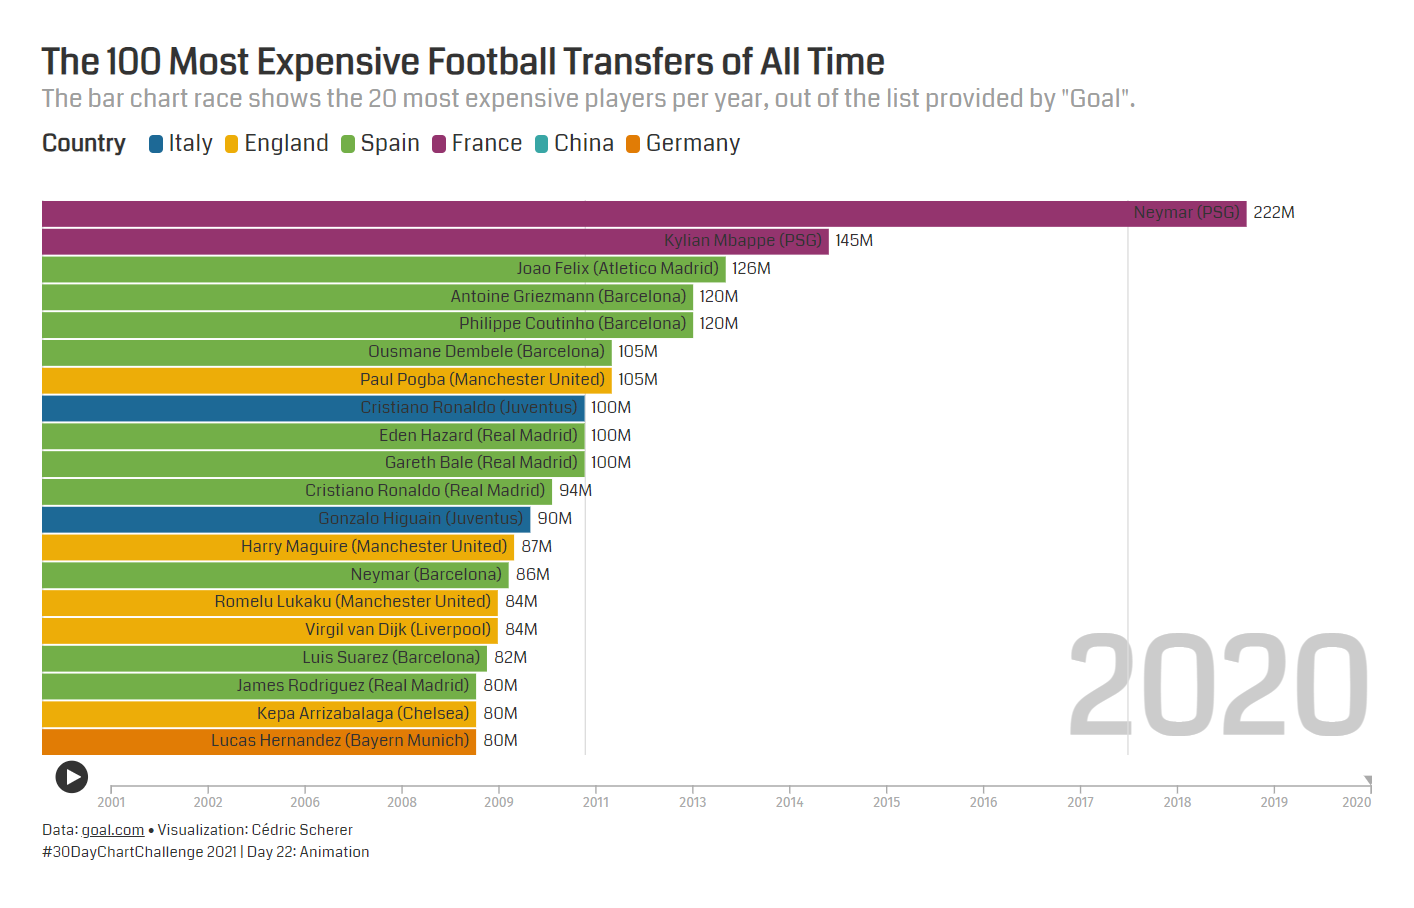
Tool: Flourish (Interactive version)
Day 23: Tiles
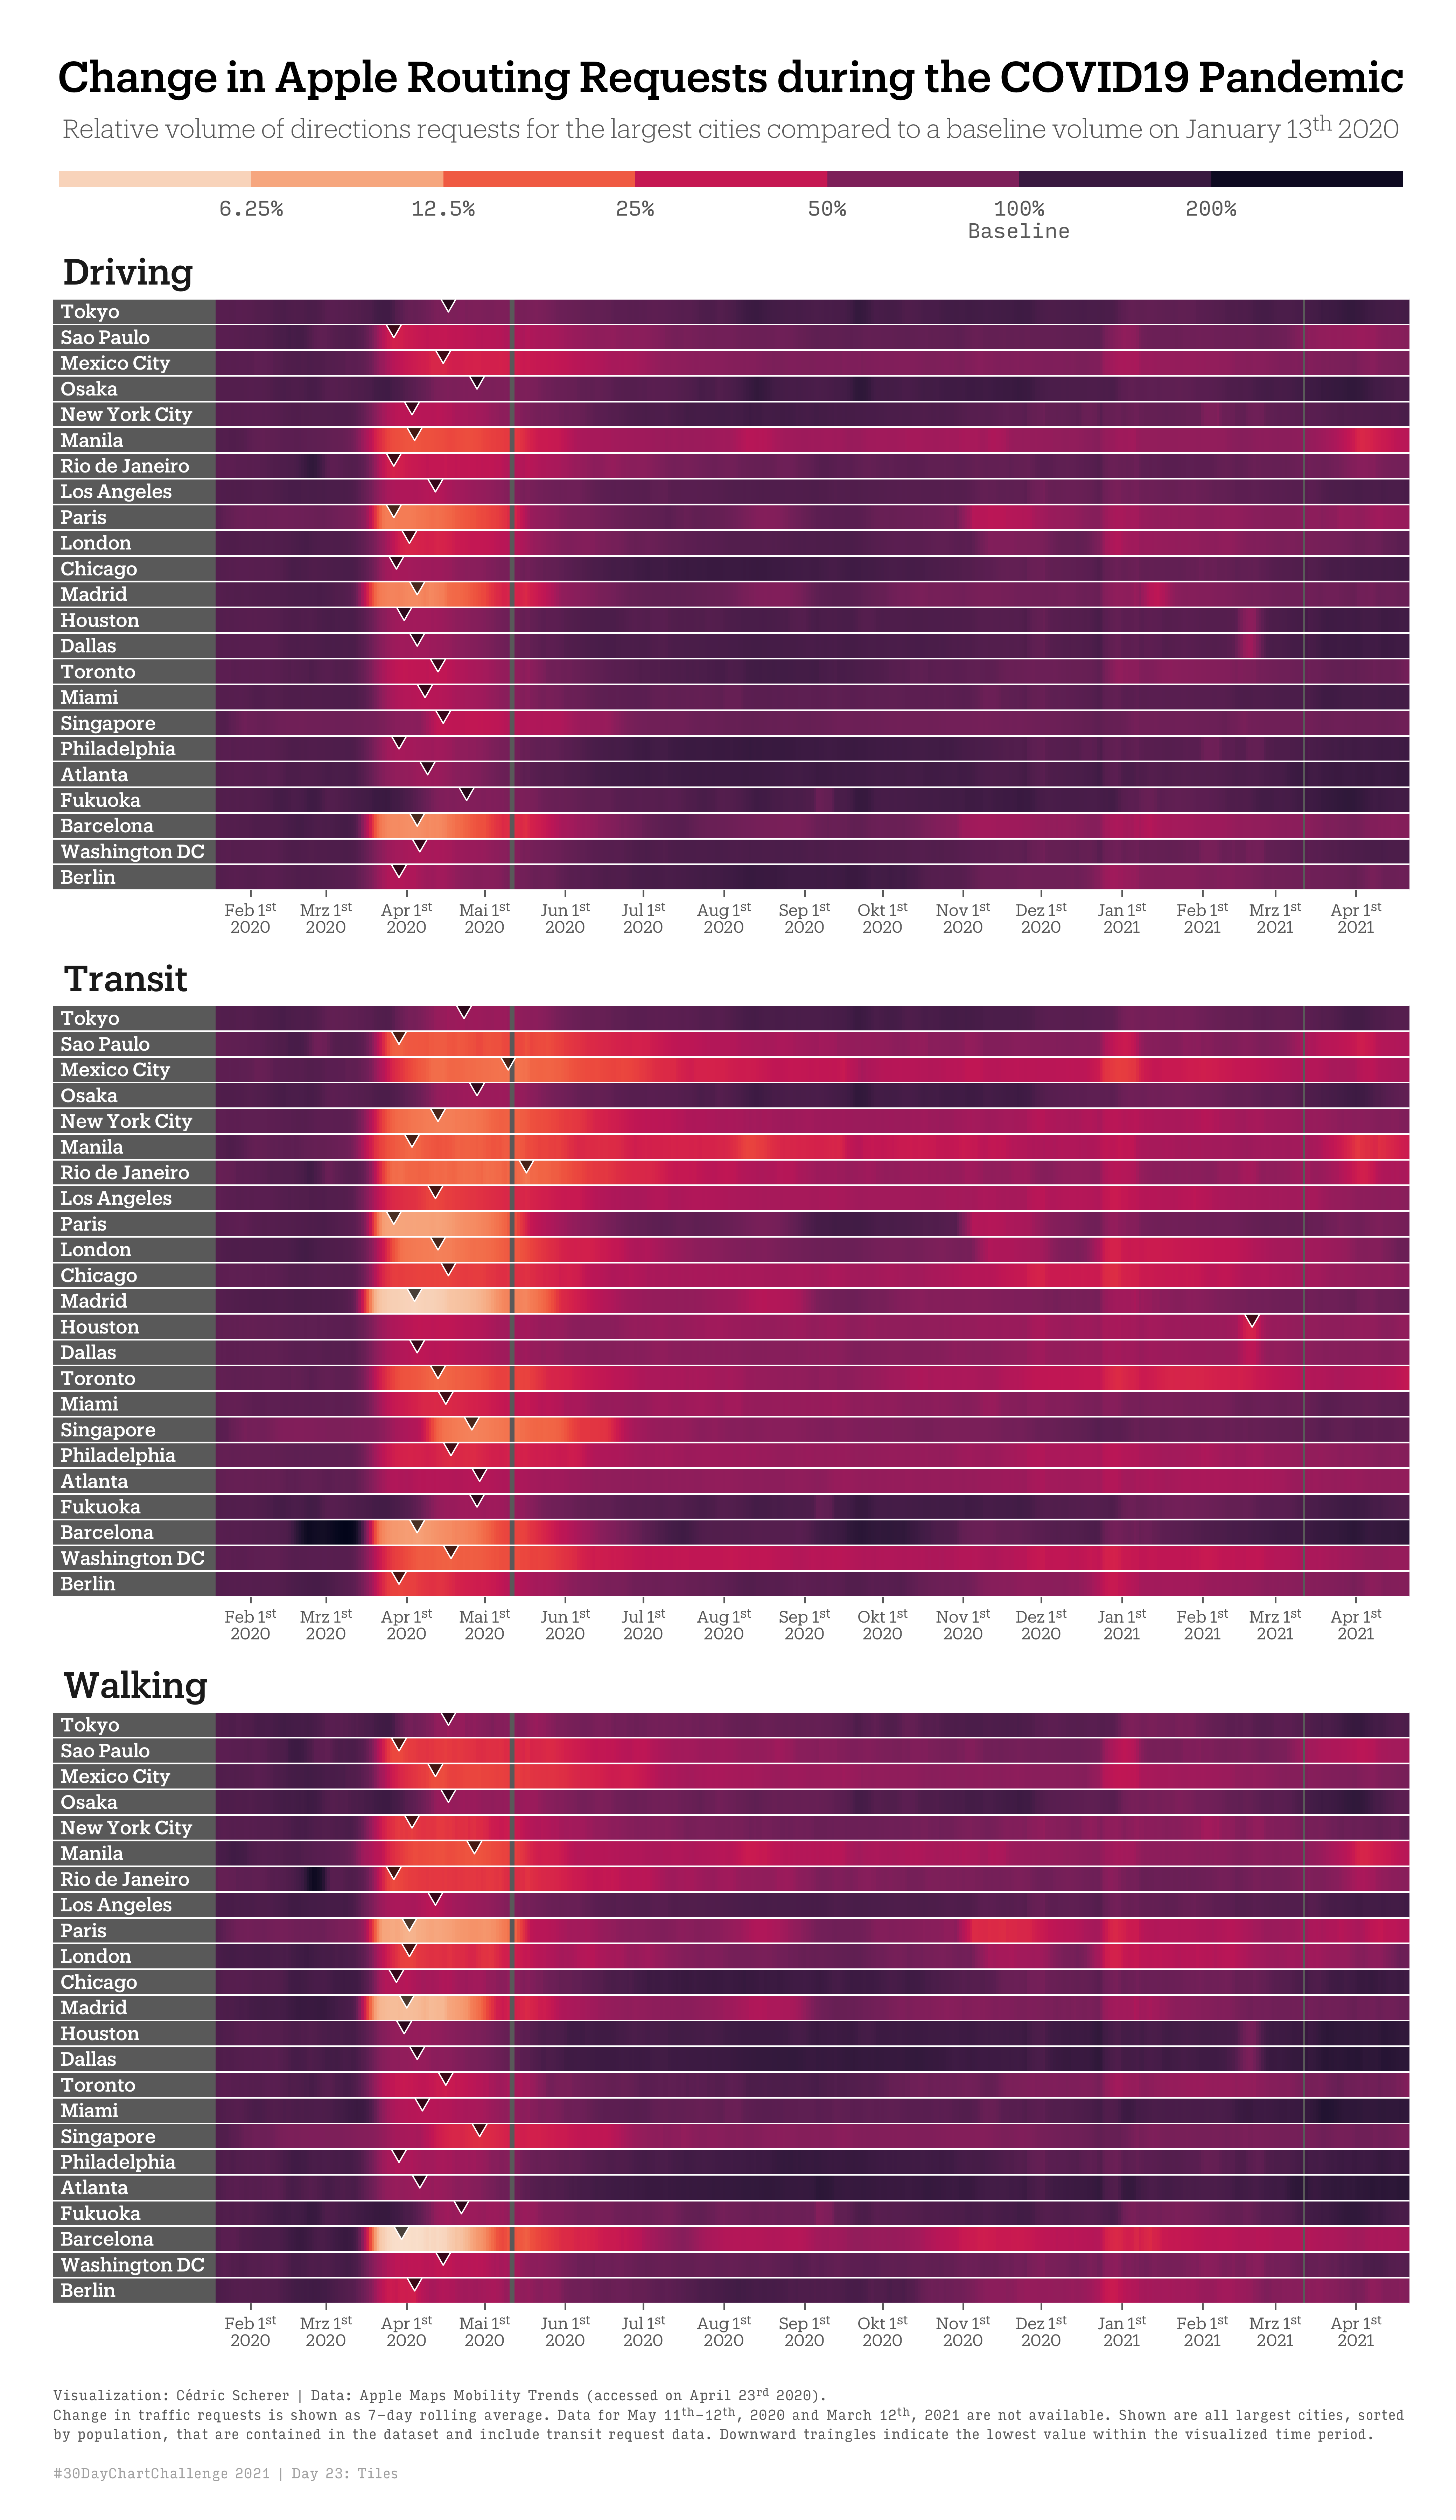
Tool: ggplot2
Uncertainties
Day 27: Educational
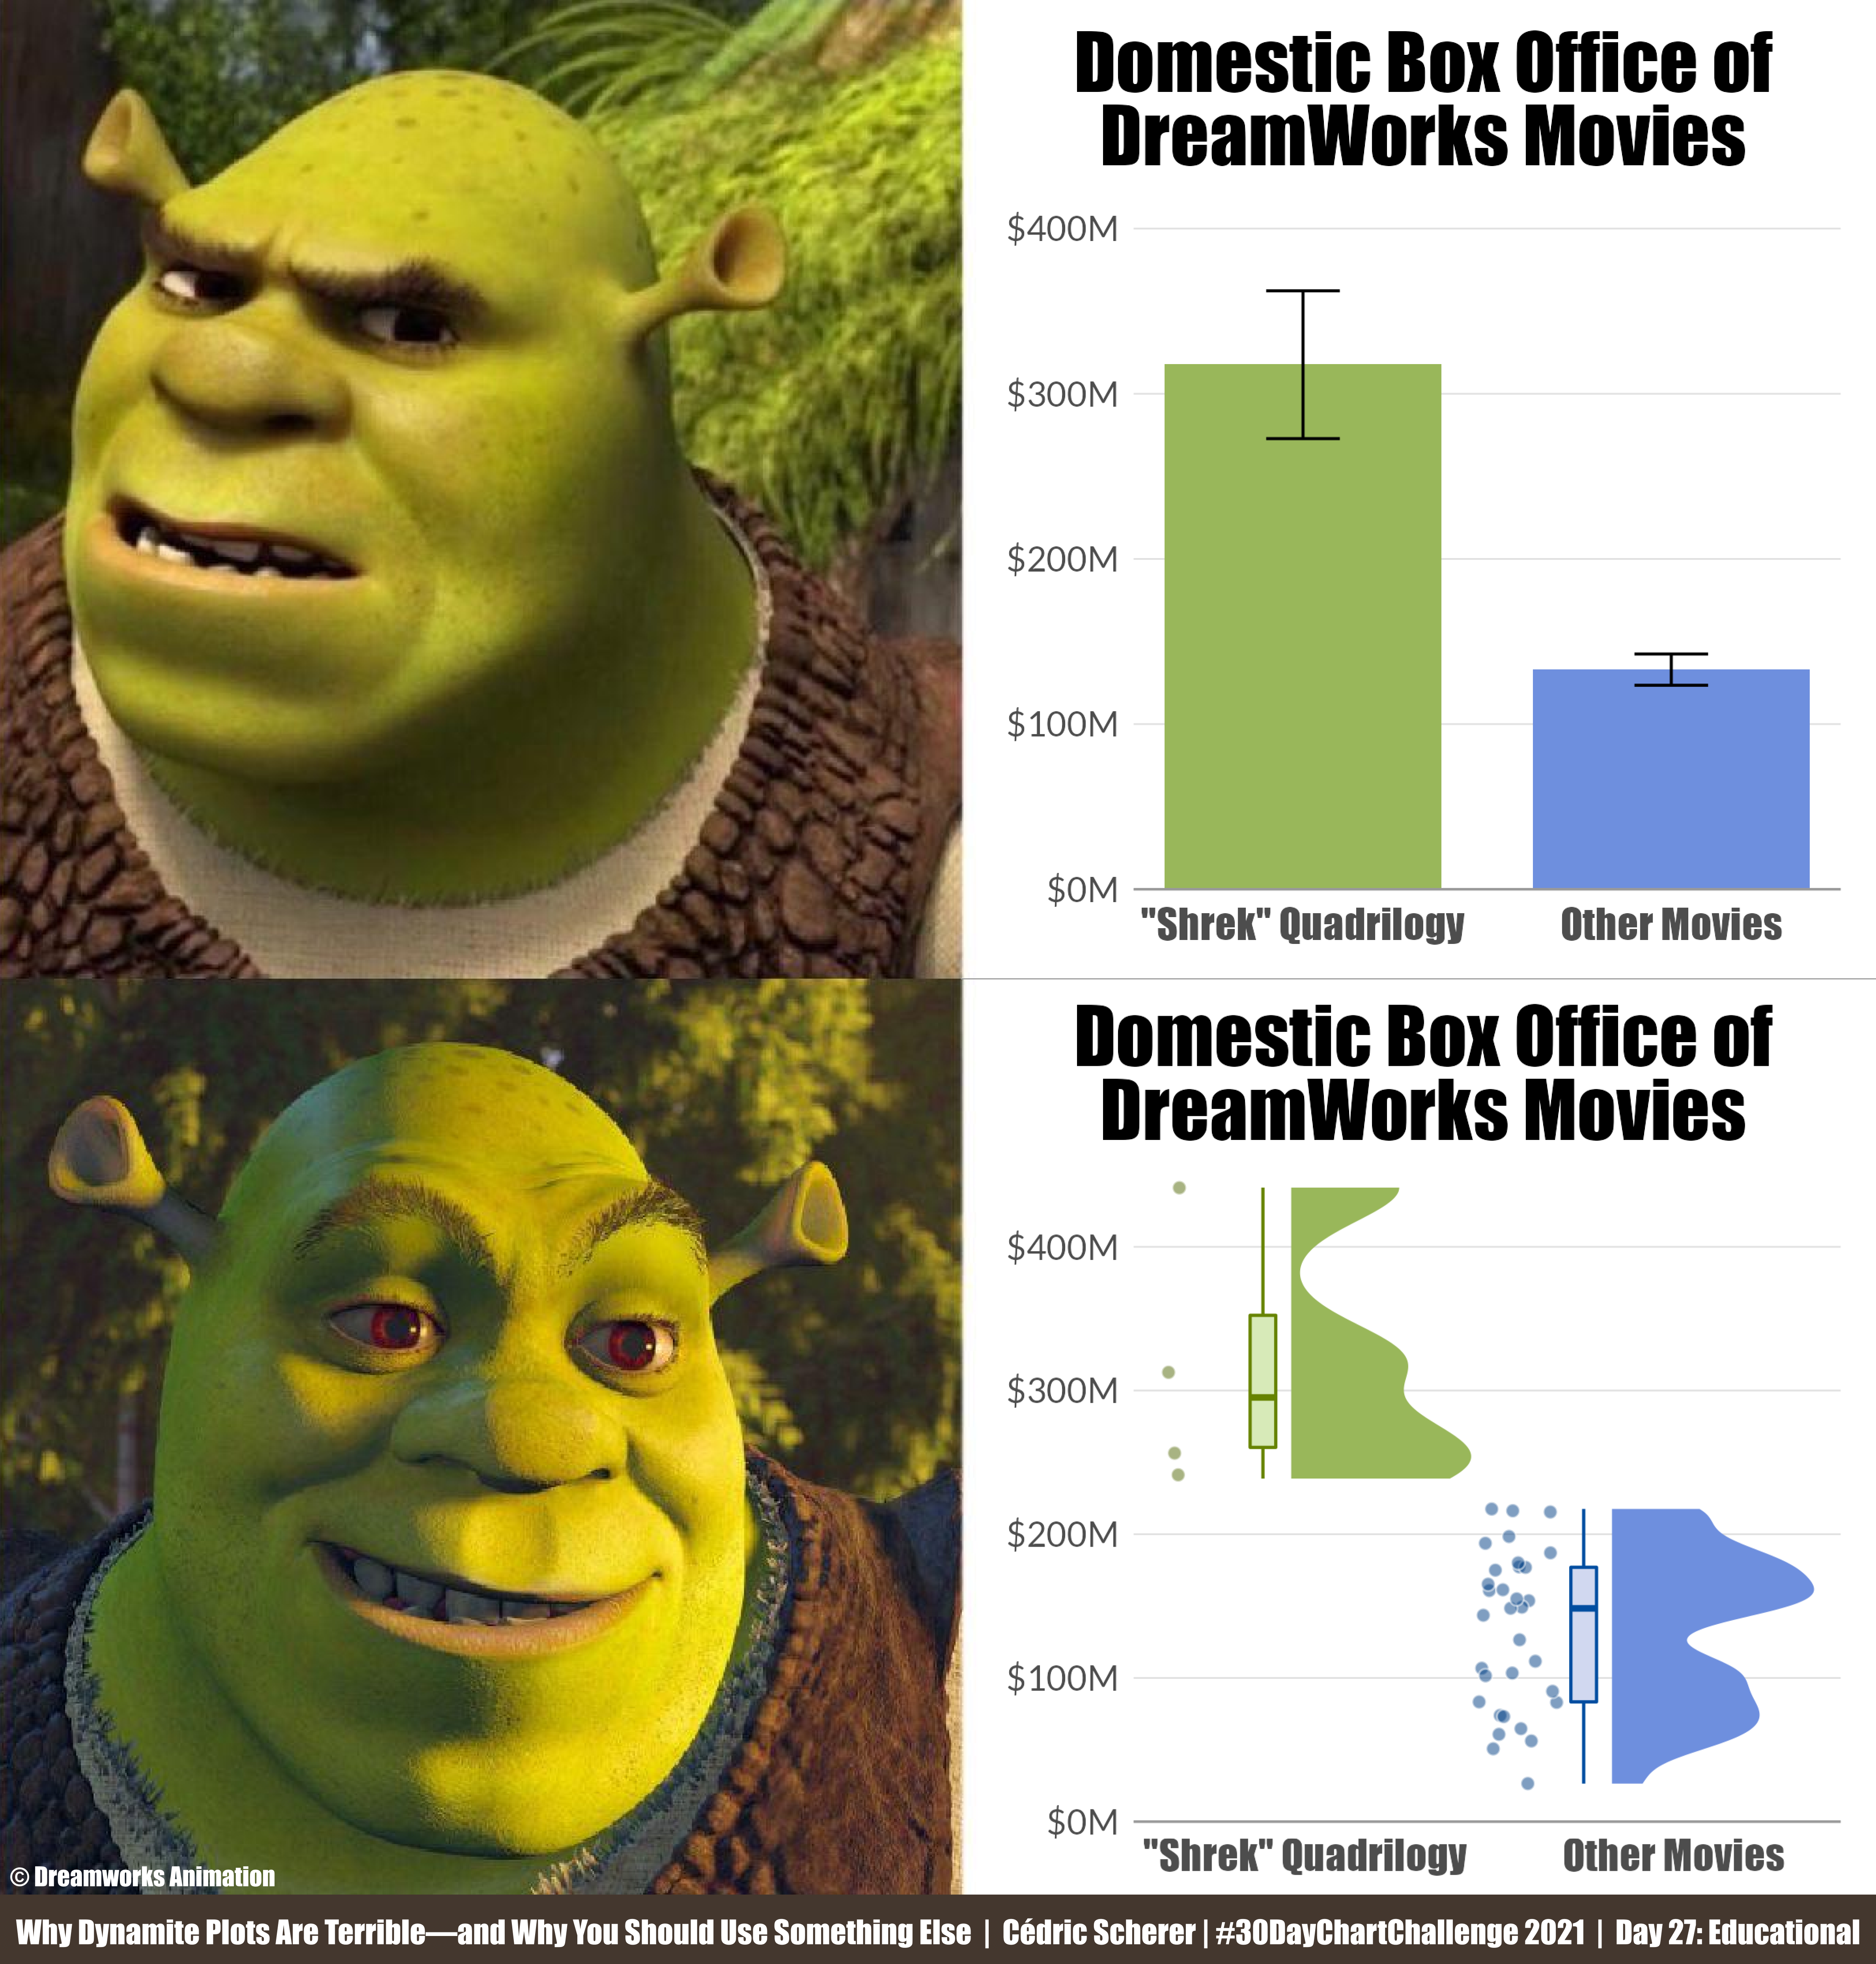
Tools: ggplot2 and Figma
Day 30: 3D
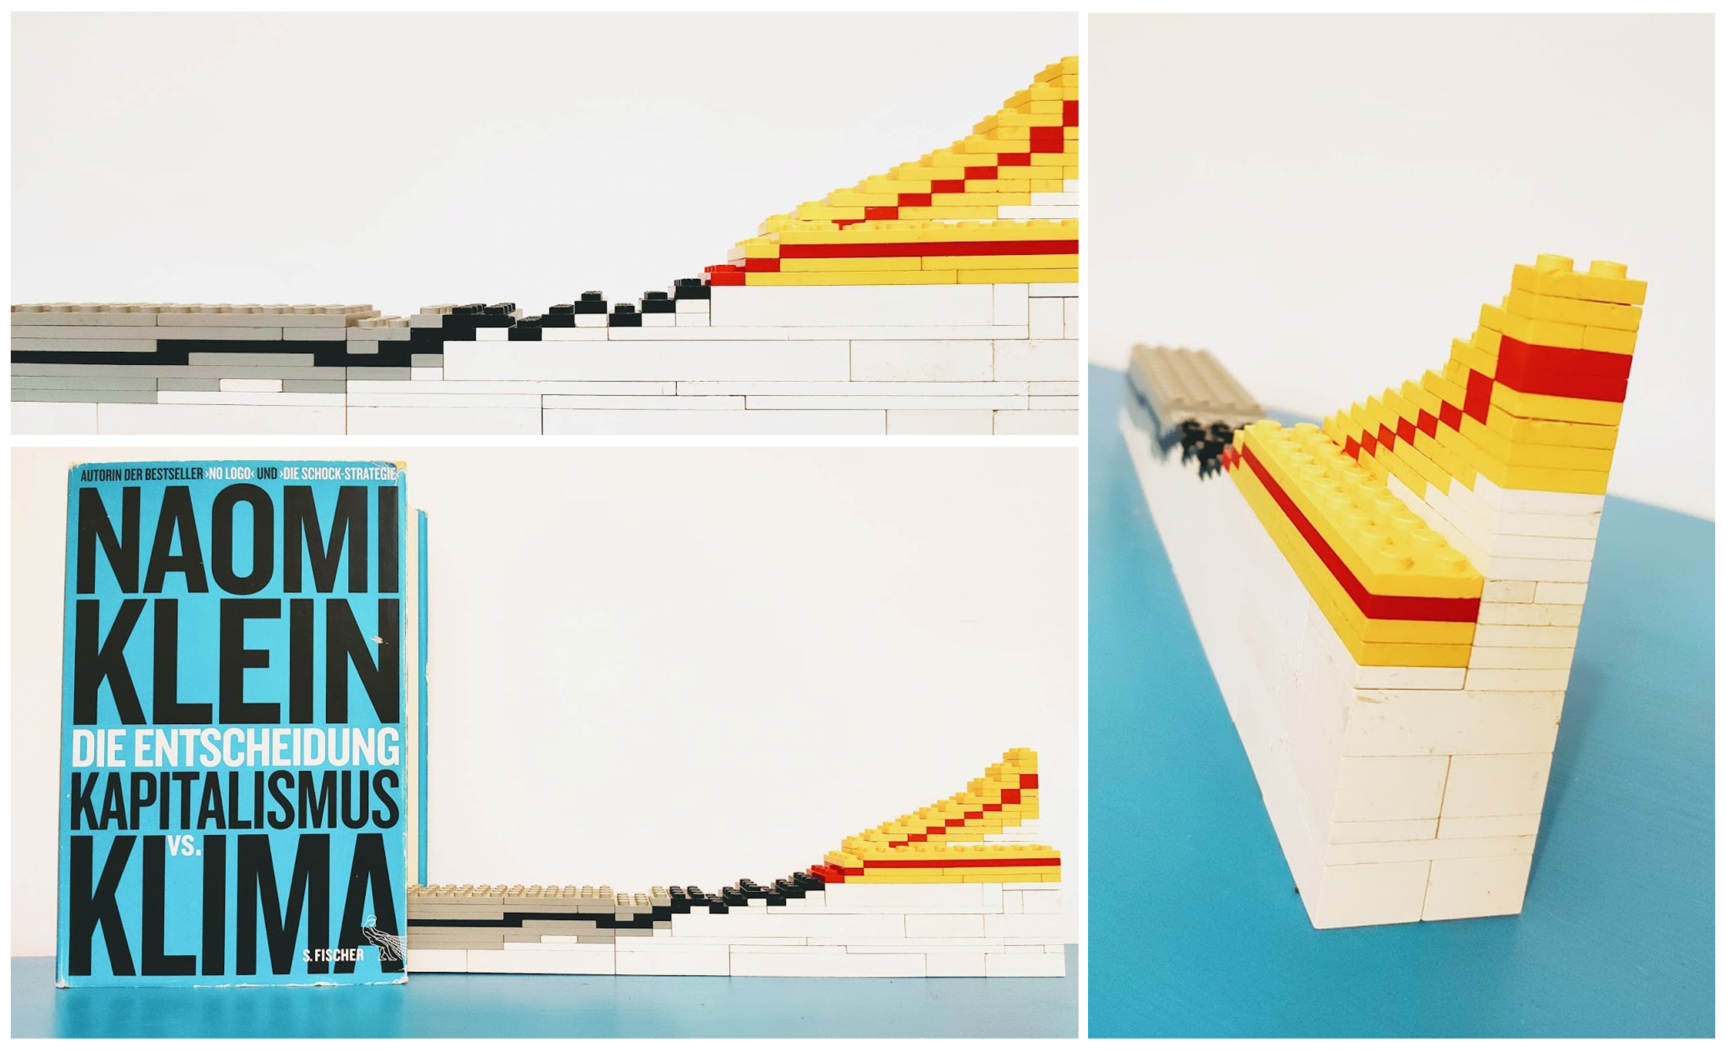
Tool: Lego