xaringan

xaringan copied to clipboard
pagedown::chrome_print not printing figures in xaringan slides using .left-column/.right-column
Why does the figure disappear when pagedown prints the slides? And how can i fix it?
---
title: "Presentation Ninja"
subtitle: "⚔<br/>with xaringan"
author: "Yihui Xie"
institute: "RStudio, PBC"
date: "2016/12/12 (updated: `r Sys.Date()`)"
knit: pagedown::chrome_print
output:
xaringan::moon_reader:
lib_dir: libs
nature:
highlightStyle: github
highlightLines: true
countIncrementalSlides: false
---
```{r setup, include=FALSE}
options(htmltools.dir.version = FALSE)
knitr::opts_chunk$set(echo = FALSE)
```
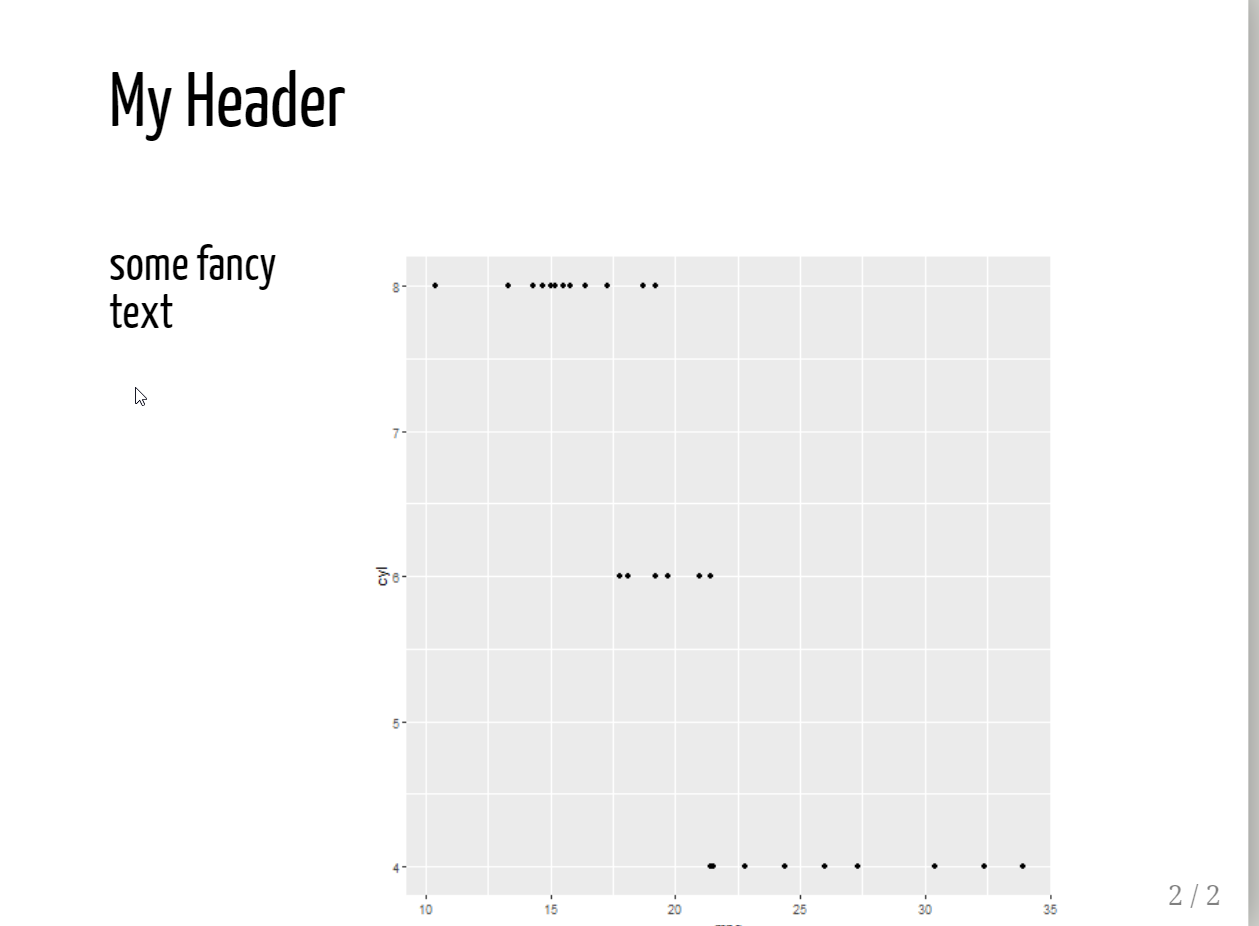
# My Header
.left-column[
### some fancy text
]
.right-column[
```{r}
ggplot2::ggplot(mtcars,ggplot2::aes(mpg,cyl)) + ggplot2::geom_point()
```
]
html output
session info
- Session info -------------------------------------------------------------------------------------------------------------------------------------------------------
 setting  value
 version  R version 4.0.2 (2020-06-22)
 os       Windows 10 x64
 system   x86_64, mingw32
 ui       RStudio
 language (EN)
 collate  English_United States.1252
 ctype    English_United States.1252
 tz       America/New_York
 date     2020-12-10

- Packages -----------------------------------------------------------------------------------------------------------------------------------------------------------
 ! package     * version   date       lib source
 P assertthat    0.2.1     2019-03-21 [?] CRAN (R 4.0.2)
   backports     1.2.0     2020-11-02 [1] CRAN (R 4.0.3)
 P cli           2.1.0     2020-10-12 [?] CRAN (R 4.0.3)
 P clipr         0.7.0     2019-07-23 [?] CRAN (R 4.0.2)
 P colorspace    1.4-1     2019-03-18 [?] CRAN (R 4.0.2)
 P crayon        1.3.4     2017-09-16 [?] CRAN (R 4.0.2)
 P desc          1.2.0     2018-05-01 [?] CRAN (R 4.0.2)
 P details       0.2.1     2020-09-08 [?] local
   digest        0.6.27    2020-10-24 [1] CRAN (R 4.0.3)
 P dplyr         1.0.2     2020-08-18 [?] CRAN (R 4.0.2)
 P ellipsis      0.3.1     2020-05-15 [?] CRAN (R 4.0.2)
 P evaluate      0.14      2019-05-28 [?] CRAN (R 4.0.2)
 P fansi         0.4.1     2020-01-08 [?] CRAN (R 4.0.2)
 P farver        2.0.3     2020-01-16 [?] CRAN (R 4.0.2)
 P generics      0.1.0     2020-10-31 [?] CRAN (R 4.0.3)
 P ggplot2       3.3.2     2020-06-19 [?] CRAN (R 4.0.2)
 P glue          1.4.2     2020-08-27 [?] CRAN (R 4.0.2)
 P gtable        0.3.0     2019-03-25 [?] CRAN (R 4.0.2)
 P htmltools     0.5.0     2020-06-16 [?] CRAN (R 4.0.2)
 P httr          1.4.2     2020-07-20 [?] CRAN (R 4.0.2)
 P knitr         1.30      2020-09-22 [?] CRAN (R 4.0.3)
 P labeling      0.3       2014-08-23 [?] CRAN (R 4.0.0)
 P lifecycle     0.2.0     2020-03-06 [?] CRAN (R 4.0.2)
 P magrittr      1.5       2014-11-22 [?] CRAN (R 4.0.2)
 P munsell       0.5.0     2018-06-12 [?] CRAN (R 4.0.2)
 P pagedown      0.12      2020-10-13 [?] CRAN (R 4.0.3)
 P pillar        1.4.6     2020-07-10 [?] CRAN (R 4.0.2)
 P pkgconfig     2.0.3     2019-09-22 [?] CRAN (R 4.0.2)
 P png           0.1-7     2013-12-03 [?] CRAN (R 4.0.0)
 P purrr         0.3.4     2020-04-17 [?] CRAN (R 4.0.2)
   R6            2.5.0     2020-10-28 [1] CRAN (R 4.0.3)
 P renv          0.12.2-13 2020-11-13 [?] Github (rstudio/renv@d022cac)
   rlang         0.4.8     2020-10-08 [1] CRAN (R 4.0.3)
 P rmarkdown     2.5       2020-10-21 [?] CRAN (R 4.0.2)
 P rprojroot     1.3-2     2018-01-03 [?] CRAN (R 4.0.2)
 P rstudioapi    0.11      2020-02-07 [?] CRAN (R 4.0.2)
 P scales        1.1.1     2020-05-11 [?] CRAN (R 4.0.2)
 P sessioninfo   1.1.1     2018-11-05 [?] CRAN (R 4.0.2)
 P stringi       1.4.6     2020-02-17 [?] CRAN (R 4.0.0)
 P stringr       1.4.0     2019-02-10 [?] CRAN (R 4.0.2)
 P tibble        3.0.4     2020-10-12 [?] CRAN (R 4.0.3)
 P tidyselect    1.1.0     2020-05-11 [?] CRAN (R 4.0.2)
 P vctrs         0.3.4     2020-08-29 [?] CRAN (R 4.0.2)
   withr         2.3.0     2020-09-22 [1] CRAN (R 4.0.2)
 P xaringan      0.17.4    2020-10-20 [?] Github (yihui/xaringan@8c921da)
 P xfun          0.18      2020-09-29 [?] CRAN (R 4.0.3)
 P xml2          1.3.2     2020-04-23 [?] CRAN (R 4.0.2)
 P yaml          2.2.1     2020-02-01 [?] CRAN (R 4.0.2)

[1] C:/trials/217-MDD-303/renv/library/R-4.0/x86_64-w64-mingw32
[2] C:/Users/jonathan.sidi/AppData/Local/Temp/RtmpScp41T/renv-system-library

 P -- Loaded and on-disk path mismatch.
By filing an issue to this repo, I promise that
- [x] I have fully read the issue guide at https://yihui.org/issue/.
- [x] I have provided the necessary information about my issue.
- If I'm asking a question, I have already asked it on Stack Overflow or RStudio Community, waited for at least 24 hours, and included a link to my question there.
- If I'm filing a bug report, I have included a minimal, self-contained, and reproducible example, and have also included
xfun::session_info('xaringan'). I have upgraded all my packages to their latest versions (e.g., R, RStudio, and R packages), and also tried the development version:remotes::install_github('yihui/xaringan'). - If I have posted the same issue elsewhere, I have also mentioned it in this issue.
- [x] I have learned the Github Markdown syntax, and formatted my issue correctly.
I understand that my issue may be closed if I don't fulfill my promises.
Your figure is too tall. When you have things that are outside the plotting area then the whole object might be discarded.
Try adding fig.height to your chunk argument or set it globally in the first chunk
```{r echo=FALSE, fig.height=4}
ggplot2::ggplot(mtcars,ggplot2::aes(mpg,cyl)) + ggplot2::geom_point()
```
given that it does show up in the html, is there a way to relax the printer driver css rules not to clip it out?