problem with plot_measure
I hope this package will let me display violin plots the way I want to. But I am getting a weird error with plot_measure: "Error in dataset[[group_by]]: subscript out of bounds. Here is my code:
plot_measure(dataset = oligosnew2@[email protected], measures = "Neat1", group_by = "seurat_clusters")
I tried that but when I use the following code:
DefaultAssay(oligosnew2) <- "RNA" plot_measure(dataset = oligosnew2, measures = "Neat1", group_by = "orig.ident")
I get this error Show in New Window Error in rownames(dataset@[email protected]) : trying to get slot "scale.data" from an object of a basic class ("NULL") with no slots
I see the problem. My code tries to search genes from integrated assay first, and then RNA. Since your data object doesn't have the integrated assay, it returns the error.
Could you try a workaround to copy the RNA assay to the integrated assay using the code below?
oligosnew2@assays$integrated <- oligosnew2@assays$RNA
This is an ugly workaround but please let me know if it works for you.
Ugly workarounds are my speciality. It worked great! Love the output! Thanks!
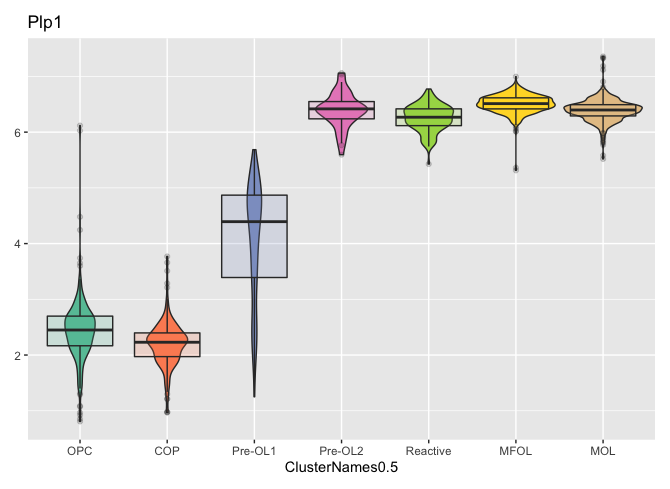
Follow up Question: what is expressed on the Y-axis? I get different scales when I plot using Scillus vs seurat. See my two attached plots for the same feature.
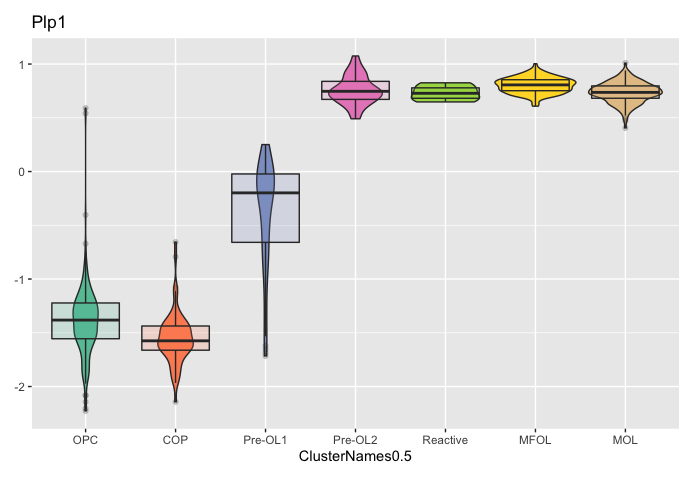
I quickly browsed my code and didn't see where I rescale the expression values. Could you check that in your data slot, the values are in the range of 2 to 6 or in the range of -2 to 1?
Well, when I use the AverageExpression function in Seurat the range is actually 3-19, so now I'm thoroughly confused.
If I do AverageExpression and specify the scale.data slot the range is -1.17-0.88
Your code must look for the scaled data slot because when I try this: oligosnew2@assays$integrated <- oligosnew2@assays$RNA@data and then run: plot_measure(oligosnew2, measures = "Rtn4", group_by = "ClusterNames0.5") I get this error: Error in rownames(dataset@[email protected]) : no slot of name "scale.data" for this object of class "dgCMatrix"
My ugly work around wins! I expect the appropriate amount of applause. Still love the output more than any other.
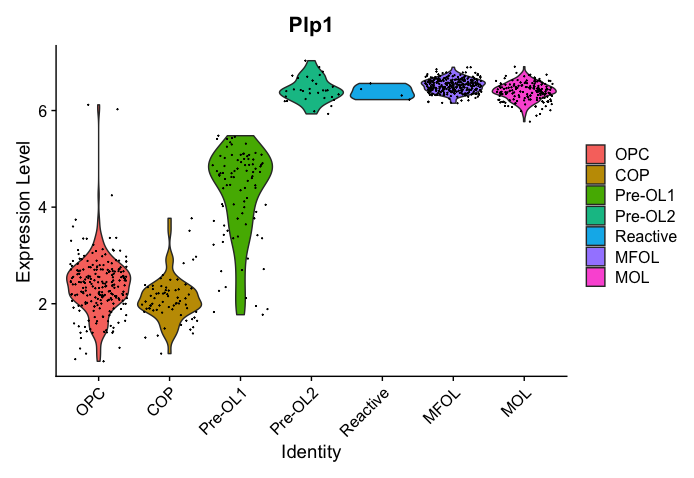
new.data <- GetAssayData(oligosnew2[["RNA"]], slot = "data")
new.data <- as.matrix(new.data)
oligosnew3 <- SetAssayData(oligosnew2, slot = "scale.data", new.data = new.data, assay = "integrated")
plot_measure(oligosnew3, measures = "Plp1", group_by = "ClusterNames0.5")