xarray-tutorial
 xarray-tutorial copied to clipboard
Published
20 hours ago •
 xarray-contrib
A few points for improving the indexing notebooks
From today's presentation, I can think of a few things to improve the whole indexing materials:
- Advanced indexing :
- [x] Add a schematic image on the subsetted points to explain the difference between the orthogonal vs. point-wise indexing. Something similar to this:
The right figure here shows it for Numpy/ poinwise indexing: 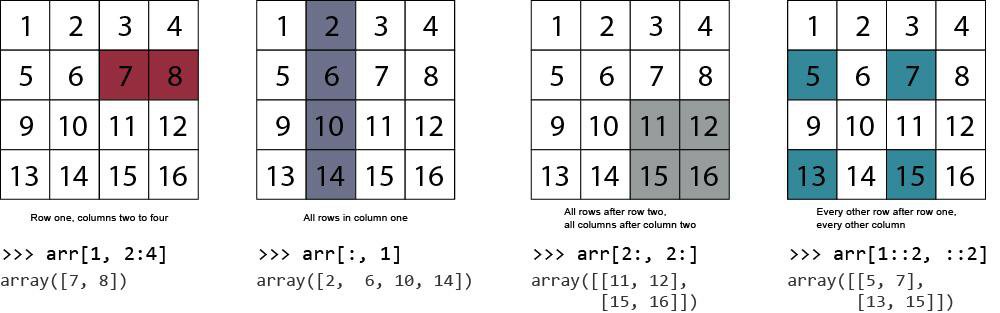 Here is another one showing the orthogonal indexing:
- [x] Adding an exercise for this notebook.
- [ ] Adding an example for this warning:
If an indexer is a
DataArray(), its coordinates should not conflict with the selected subpart of the target array (except for the explicitly indexed dimensions with.loc/.sel). Otherwise,IndexErrorwill be raised!
- Boolean indexing:
- [ ] Adding a plot of all grid locations to show how dims and physical coordinates are different for the curvilinear grid.

Okay, so I created this for adding to the tutorial, to better explain these concepts:
np_arr = np.arange(1, 26).reshape(5, 5)
np_arr [[0, 2, 4], [0, 2, 4]]
da = xr.DataArray(np_arr)
da [[0, 2, 4], [0, 2, 4]]
I will add these to our notebooks soon...