Spectrum lower frequency in blocks
EasyEffects Version
6.2.8
What package are you using?
Flatpak (Flathub)
Distribution
Ubuntu 22.04
Describe the bug
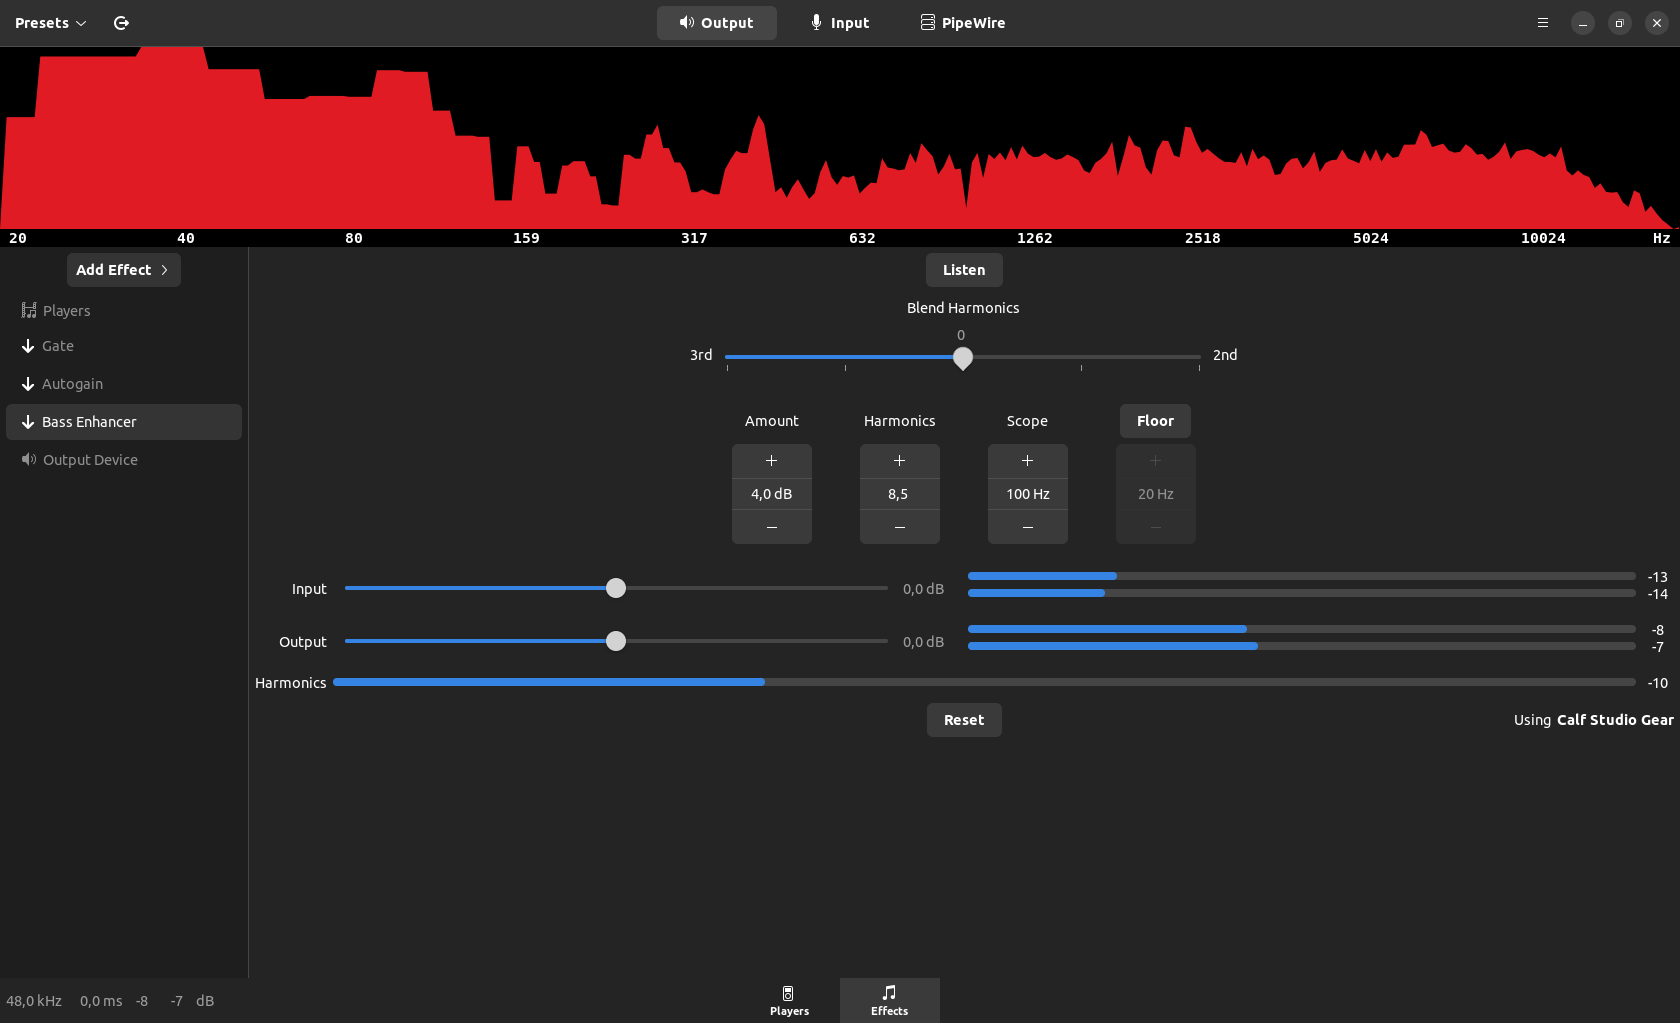
All the lower frequencies below 160 Hz are displayed in very ugly big blocks. In the old PulseEffects app the lower frequencies were rendered nice and round.
Expected Behavior
Nice looking and accurate spectrum
Debug Log
Debug Log
Paste your log here
Additional Information
No response
All the lower frequencies below 160 Hz are displayed in very ugly big blocks. In the old PulseEffects app the lower frequencies were rendered nice and round.
In PulseEffects we used the Boost library for some things including the cubic spline that was used when selecting the data that would be drawn as the spectrum. But Boost was a headache for package maintainers so when porting EE to GTK4 I removed it. The downside is that now we have to find something else to do the cubic spline. Or I have to find some time to learn how to write a code that does it.
On a somewhat related note, what happened to the Exponent, Gain, and update rate options in the spectrum settings window?
Also related to moving away from boost?
On a somewhat related note, what happened to the Exponent, Gain, and update rate options in the spectrum settings window? Also related to moving away from boost?
I would have to take a look at it but it may be related to Boost. What I remember at this moment is that at some point while moving to the direct usage of the gtk4 API keeping that scaling became problematic. As I also dropped Boost at the same time I am not sure anymore about what was the reason exactly.
That scaling also caused some inconsistencies in the value shown when moving the mouse over the spectrum. So that is something to consider if we ever try to bring it back.
I just saw that it got changed. Looks nice again, thank you.
Yes. The latest version uses the GSL library to do interpolation. Some people may consider the approach questionable from a mathematical point of view but it is the easiest way to make the graph "look good".