动手学习Kubernetes
使用kubectl + yaml配置部署docker
定义deployment.tpl
apiVersion: apps/v1
kind: Deployment
metadata:
  name: %%work.name%%
  labels:
    app.kubernetes.io/name: %%work.name%%
    app.kubernetes.io/env: %%work.env%%
spec:
  replicas: %%work.replicaCount%%
  selector:
    matchLabels:
      app.kubernetes.io/name: %%work.name%%
      app.kubernetes.io/env: %%work.env%%
  template:
    metadata:
      labels:
        app.kubernetes.io/name: %%work.name%%
        app.kubernetes.io/env: %%work.env%%
    spec:
      containers:
        - name: %%work.name%%
          image: %%work.image.repository%%:%%work.image.version%%
          imagePullPolicy: IfNotPresent
          ports:
            - name: http
              containerPort: 80
              protocol: TCP
          livenessProbe:
            httpGet:
              path: /
              port: http
          readinessProbe:
            httpGet:
              path: /
              port: http
          resources:
            limits:
              cpu: %%work.limit.cpu%%
              memory: %%work.limit.memory%%
            requests:
              cpu: %%work.limit.cpu%%
              memory: %%work.limit.memory%%
deployment的生成脚本
#!/bin/bash

ARGS=`getopt -o n:c:i:v:e:f:l:c:m --long name:,env:,replicaCount:,image:,version:,file:,:templateFile,cpu:,memory:,limitCPU:,limitMemory:,requestCPU:,requestMemory: -n 'mkdeployment.sh' -- "$@"`


if [ $? != 0 ]; then
   echo "参数错误 ./mkservice.sh -n $name"
   exit 1
fi

# echo $ARGS
eval set -- "$ARGS"

while true
do
  case "$1" in
      -n|--name)
        name=$2
        shift 2
        ;;
      -e|--env)
        env=$2
        shift 2
        ;;
      -f|--file)
        outFile=$2
        shift 2
        ;;
      -l|--templateFile)
        templateFile=$2
        shift 2
        ;;
      -c|--replicaCount)
        replicaCount=$2
        shift 2
        ;;
      -i|--image)
        image=$2
        shift 2
        ;;
      -v|--version)
        version=$2
        shift 2
        ;;
      -c|--cpu)
        cpu=$2
        shift 2
        ;;
      -m|--memory)
        memory=$2
        shift 2
        ;;
      --limitCPU)
        limitCPU=$2
        shift 2
        ;;
      --limitMemory)
        limitMemory=$2
        shift 2
        ;;
      --requestCPU)
        requestCPU=$2
        shift 2
        ;;
      --requestMemory)
        requestMemory=$2
        shift 2
        ;;
      --)
        shift
        break
        ;;
      *)
        echo "error"
        exit 1
        ;;
  esac
done

if [  "$#" -gt 0 ]; then
  echo "使用了多余的参数,请检查"
  for arg in $@
  do
    echo "processing $arg"
  done
  exit 1
fi


[ -z "$name" ] && echo "name 不能为空" && exit 1;
[ -z "$image" ] && echo "image 参数不能为空" && exit 1;
env=${env:-test}
replicaCount=${replicaCount:-1}
version=${version:-latest}

[ -z "$cpu" ] && cpu=100m
[ -z "$memory" ] && memory=256Mi

[ -z "$requestCPU" -a ! -z "$cpu" ] && requestCPU=$cpu
[ -z "$requestMemory" -a ! -z "$memory" ] && requestMemory=$memory

[ -z "$limitCPU" ] && limitCPU=$requestCPU
[ -z "$limitMemory" ] && limitMemory=$requestMemory


cDir=$(cd $(dirname .);pwd)
[ -z "$outFile" ] && outputFile=$cDir/deployment.yaml
[ -z "$templateFile" ] &&  templateFile=$cDir/deployment.tpl


sed "s#%%work.name%%#$name#g; s#%%work.env%%#$env#g;s/%%work.replicaCount%%/$replicaCount/g;s#%%work.image.repository%%#$image#g;s/%%work.image.version%%/$version/g;s/%%work.limit.cpu%%/$limitCpu/g;s/%%work.limit.memory%%/$limitMemory/g;s/%%work.request.cpu%%/$requestCpu/g;s/%%work.request.memory%%/$requestMemory/g;" $templateFile > $outputFile
定义service.tpl
apiVersion: v1
kind: Service
metadata:
  name: %%worker.service.name%%
  labels:
    app.kubernetes.io/name: %%work.name%%
    app.kubernetes.io/env: %%work.env%%
spec:
  type: %%worker.service.type%%
  ports:
    - port: %%worker.service.port%%
      targetPort: http
      protocol: TCP
      name: http
  selector:
    app.kubernetes.io/name: %%work.name%%
    app.kubernetes.io/env: %%work.env%%
生成service.yaml的脚本
!/bin/bash

ARGS=`getopt -o n:s:t:p:e:f:l --long name:,env:,serviceName:,serviceType:,port:,file:,:templateFile -n 'mkservice.sh' -- "$@"`

if [ $? != 0 ]; then
   echo "参数错误 ./mkservice.sh -n $name"
   exit 1
fi

# echo $ARGS
eval set -- "$ARGS"

while true
do
  case "$1" in
      -n|--name)
        name=$2
        shift 2
        ;;
      -e|--env)
        env=$2
        shift 2
        ;;
      -f|--file)
        outFile=$2
        shift 2
        ;;
      -l|--templateFile)
        templateFile=$2
        shift 2
        ;;
      -s|--serviceName)
        serviceName=$2
        shift 2
        ;;
      -t|--serviceType)
        serviceType=$2
        shift 2
        ;;
      -p|--port)
        port=$2
        shift 2
        ;;
      --)
        shift
        break
        ;;
      *)
        echo "error"
        exit 1
        ;;
  esac
done

if [  "$#" -gt 0 ]; then
  echo "使用了多余的参数,请检查"
  for arg in $@
  do
    echo "processing $arg"
  done
  exit 1
fi

[ -z "$name" ] && echo "name 不能为空" && exit 1;

env=${env:-test}

[ -z "$serviceName" ] && serviceName=$name-service
type=${serviceType:-ClusterIP}
port=${port:-80}

cDir=$(cd $(dirname .);pwd)


echo "$name $serviceName, $port, $env, $serviceType"

[ -z "$outFile" ] && outputFile=$cDir/service.yaml
[ -z "$templateFile" ] &&  templateFile=$cDir/service.tpl

sed "s#%%work.name%%#$name#g; s#%%work.env%%#$env#g;;s/%%worker.service.type%%/$type/g;s/%%worker.service.port%%/$port/g;s/%%worker.service.name%%/$serviceName/g;" $templateFile > $outputFile
脚本使用
依赖属性, 通过发版平台来定义
appName=
env=test
replicaCount=2
image=
version=
outputDir=
scriptDir=
servicePort=
参数传递,通过环境变量
#!/bin/bash
mkdir -p $outputDir
$scriptDir/mkdeployments.sh --name $appName --image $image --version $version --templateFile $scriptDir/deployment.tpl --file $outputDir/deployment.yaml --env $env --replicaCount 2
$scriptDir/mkservice.sh --name $appName --env $env --templateFile $scriptDir/service.tpl --file $outputDir/service.yaml --port=$servicePort
kubectl apply -f $outputDir
K8S 如何调试日志:
查看pod日志
$ kubectl logs zookeeper-1
## 可以通过--previous 参数查看之前的pod日志
$ kubectl logs zookeeper-1 --previous
## minikube 也有 minikube logs的日志
查看pod的生命周期的事件
## 命令 kubectl describe pod podname
$ kubectl describe pod bedoss-deploy-5767f7b56b-6ld27
Name:         bedoss-deploy-5767f7b56b-6ld27
Namespace:    default
Priority:     0
Node:         minikube/192.168.99.103
Start Time:   Thu, 13 Feb 2020 17:27:20 +0800
Labels:       app=myapp
              env=test
              pod-template-hash=5767f7b56b
              release=stabel
Annotations:  <none>
Status:       Running
IP:           172.17.0.2
IPs:
  IP:           172.17.0.2
Controlled By:  ReplicaSet/bedoss-deploy-5767f7b56b
Containers:
  myapp:
    Container ID:   docker://199a7789a43503c3b062fb25653af520e9559f52fec33f75773730fa340b89d3
    Image:          nginx:latest
    Image ID:       docker-pullable://nginx@sha256:ad5552c786f128e389a0263104ae39f3d3c7895579d45ae716f528185b36bc6f
    Port:           80/TCP
    Host Port:      0/TCP
    State:          Running
      Started:      Thu, 13 Feb 2020 17:35:45 +0800
    Last State:     Terminated
      Reason:       Completed
      Exit Code:    0
      Started:      Thu, 13 Feb 2020 17:27:21 +0800
      Finished:     Thu, 13 Feb 2020 17:33:50 +0800
    Ready:          True
    Restart Count:  1
    Environment:    <none>
    Mounts:
      /var/run/secrets/kubernetes.io/serviceaccount from default-token-p8z8j (ro)
Conditions:
  Type              Status
  Initialized       True
  Ready             True
  ContainersReady   True
  PodScheduled      True
Volumes:
  default-token-p8z8j:
    Type:        Secret (a volume populated by a Secret)
    SecretName:  default-token-p8z8j
    Optional:    false
QoS Class:       BestEffort
Node-Selectors:  <none>
Tolerations:     node.kubernetes.io/not-ready:NoExecute for 300s
                 node.kubernetes.io/unreachable:NoExecute for 300s
Events:          <none>
查看pod重启的原因
依然通过describe 命令 Containers.[*].Last State 一节
$ kubectl describe pod podname
Name:       kafka-1
...

Containers:
  kafka:
    State:      Running
       Started:     Sat, 08 Apr 2017 02:29:04 +0000
    Last State:     Terminated
       Reason:      OOMKilled
      Exit Code:    0
       Started:     Fri, 07 Apr 2017 11:06:56 +0000
      Finished:     Sat, 08 Apr 2017 02:29:04 +0000
    Ready:      True
   Restart Count:   1
比如,上节可以看到Container因为内存太多,被OOMKilled了
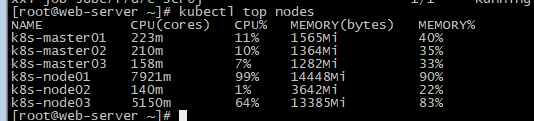
查看k8s的资源使用
需要安装heapster
# 查看使用最多的node
$ kubectl top nodes
# 查看使用最多的pods
$ kubectl top pods
# 查看节点的资源使用情况
$ kubectl describe nodes | grep -A 2 -e "^\\s*CPU Requests"
摘除某个pod进行debug
使用label机制,对Pod进行标记。在Service定义中,我们添加 status: serving字段。当需要摘下某个Pod做Debug,而又不影响整个服务,可以:
$ kubectl get pods --selector="status=serving"
$ kubectl label pods webserver-rc-lxag2 --overwrite status=debuging
此时kubelet就会把这个Pod从Service的后端列表中删掉。等到Debug完,想恢复?再改回去就好了:
$ kubectl label pods webserver-rc-lxag2 --overwrite status=serving
k8s 进入容器进行调试
格式
kubectl exec -it <podName> -c <containerName> -n <namespace> -- shell comand
比如
#适用于当前pod只有一个容器
kubectl exec -it superset-3fpnq -- /bin/bash
#适用于当前pod只有一个容器 --container or -c 参数
kubectl exec -it superset-3fpnq --container main-app -- /bin/bash
kubernates 工具
- Library to watch and follow kubernetes resources in CI/CD deploy
- Log viewer for kubernetes with live tail for multiple pods, powerful filters, highlighters and bookmarks | Overview
参考
- 10 Most Common Reasons Kubernetes Deployments Fail
- Kubernetes环境下的各种调试方法
- 介绍一个小工具:Kubedog
- Library to watch and follow kubernetes resources in CI/CD deploy pipelines
- 介绍一个小工具:Ksniff:网络抓包
- Github ksniff
- Kubespy:实时查看 Kubernetes 资源
- K8s常见问题处理办法
- arminc/k8s-platform-lcm: A faster and easier way to manage the lifecycle of applications and tools, running and living around your Kubernetes platform
Kubernates 部署
- Setting up a private Helm chart repository on GitHub | by Jasiek Petryk | Medium
- Comparison between Helm and Kustomize for Kubernetes yaml management | by Masato Naka | Medium
- Using Makefiles And Envsubst As An Alternative To Helm And Ksonnet
运维工具
- 安装工具 Kops:The easiest way to get a production grade Kubernetes cluster up and running.
- Kind, Cilium, MetalLB, and still no kube-proxy | by Charles-Edouard Brétéché | Jan, 2022 | Medium
CI/CD
运维操作
pod 操作
强制删除
kubectl delete pod typhon-server-docker-8575667448-nmfk8 --grace-period=0 --force
回滚
- 记录历史 --record
kubectl apply -f **** --record
- 查看当前状态
kubectl rollout status deployment/demo -w
- 查看历史
kubectl rollout history deployment/demo
- 回滚到指定版本
# --to-revision不写,默认回到上一个版本
kubectl rollout undo deployment/demo --to-revision=1
扩容
- Aliyun autoscaler : contains autoscaling-related components for Kubernetes.
k8s 部署策略
参考部署策略

灰度测试
这里的场景局限于部署层面的灰度,Istio 层面的暂不考虑
基于原生的方案基本就是 1 个 Service + 2 个 Deployment 通过 Label 控制
                       +------------+
                       |            | <Label>
                       |   Service  |        app:test
                       |            |
                       +------------+


    +------------+                        +------------+
    |            |<Label>                |            | <Label>
    | Deployment |        app:test        | Deployment |        app:test
    |            |        timestamp:v1    |            |        timestamp:v2
    +------------+                        +------------+
平台层面做灰度的话,灰度期间严格限制操作,支持撤销和全量灰度的选项。考虑到要兼顾滚动更新,如果不想再实现一遍业务逻辑的话,可以按照当前副本数百分比和灰度上限来控制灰度 Deployment 的副本数。实际全量灰度的时候还是更新现有的 Deployment,删除当前灰度的 Deployment,这样实际更新的时候还是可以做到滚动机制,也是一种灰度方式。
定时部署代码
参考[kubernetes-cronhpa-controller]
迁移
调度
keel-hq/keel: Kubernetes Operator to automate Helm, DaemonSet, StatefulSet & Deployment updates
Node Affinity 与 Taint and Tolerations
Application Deployment Engine
- RIO: Application Deployment Engine for k8s
参考
- Kubernetes的几种主流部署方式02-kubeadm部署高可用集群
- Kubernetes的几种主流部署方式01-minikube部署
- Kubernetes学习
- 包管理:krew
- 配置校验校验工具;Kubeval
- 批量操作:Krew:Bulk-Action
- K8S 分布式构建 Docker 镜像的一些小技巧
- 几个 Docker/Kubernetes 构建-推送-部署流程工具
- Helm 和 Kustomize:不只是含谷量的区别
- K8s滚动升级
- kubernates deployments strategies
- kubernetes-cronhpa-controller
- 实例演示:如何在Kubernetes上大规模运行CI/CD
- 影响K8S Pod分配和调度策略的两大关键特性
- 超详细实操教程!在现有K8S集群上安装JenkinsX,极速提升CI/CD体验!
- Rancher 2.3实现K8S一键式升级!再也不用同步升级Rancher啦!
- Rio手把手教学:如何打造容器化应用程序的一站式部署体验
- 重启 Kubernetes Pod的几种方式
- k8s 节点的 NodeAffinity 使用 20 Assigning Pods to Nodes
- Taints and Tolerations
- 【Kubernetes】Pod学习(十四)Deployment的升级策略
- Kubernetes Deployment Strategies
- A deep dive into Kubernetes Deployment strategies
- Gradual Releases with an In-House Kubernetes Canary Controller
- kubernetes-sigs/node-feature-discovery: Node feature discovery for Kubernetes
Kubernetes 证书
介绍
证书
集群相关证书类型
- client certificate: 用于服务端认证客户端,例如etcdctl、etcd proxy、fleetctl、docker客户端
- server certificate: 服务端使用,客户端以此验证服务端身份,例如docker服务端、kube-apiserver
- peer certificate: 双向证书,用于etcd集群成员间通信
根据认证对象可以将证书分成三类:服务器证书server cert,客户端证书client cert,对等证书peer cert(表示既是server cert又是client cert),在kubernetes 集群中需要的证书种类如下:
etcd 节点需要标识自己服务的server cert,也需要client cert与etcd集群其他节点交互,当然可以分别指定2个证书,也可以使用一个对等证书 master 节点需要标识 apiserver服务的server cert,也需要client cert连接etcd集群,这里也使用一个对等证书 kubectl calico kube-proxy 只需要client cert,因此证书请求中 hosts 字段可以为空 kubelet证书比较特殊,不是手动生成,它由node节点TLS BootStrap向apiserver请求,由master节点的controller-manager 自动签发,包含一个client cert 和一个server cert
工具
CFSSL是CloudFlare开源的一款PKI/TLS工具。 CFSSL 包含一个命令行工具 和一个用于 签名,验证并且捆绑TLS证书的 HTTP API 服务。 使用Go语言编写。
Github 地址: https://github.com/cloudflare/cfssl
官网地址: https://pkg.cfssl.org/
安装
curl -s -L -o /bin/cfssl https://pkg.cfssl.org/R1.2/cfssl_linux-amd64
curl -s -L -o /bin/cfssljson https://pkg.cfssl.org/R1.2/cfssljson_linux-amd64
curl -s -L -o /bin/cfssl-certinfo https://pkg.cfssl.org/R1.2/cfssl-certinfo_linux-amd64
chmod +x /bin/cfssl*
使用例子
参考
- Kubernetes证书相关(CFSSL)
- kubectl的用户认证授权
- 如何平滑优雅地在Rancher 2.x中升级cert-manager
- k8s权限管理
- Generate Self Signed Certificates for Kubernetes {4 Methods}
- SSL基础:23:生成Kubernetes集群证书(OpenSSL方式)_知行合一 止于至善-CSDN博客
- Kubernetes and SSL Certificate Management | by Al-Waleed Shihadeh | Better Programming
kubernates 监控
介绍
Heapster
Heapster是Kubernetes旗下的一个项目,Heapster是一个收集者,并不是采集
1.Heapster可以收集Node节点上的cAdvisor数据:CPU、内存、网络和磁盘 2.将每个Node上的cAdvisor的数据进行汇总 3.按照kubernetes的资源类型来集合资源,比如Pod、Namespace 4.默认的metric数据聚合时间间隔是1分钟。还可以把数据导入到第三方工具ElasticSearch、InfluxDB、Kafka、Graphite 5.展示:Grafana或Google Cloud Monitoring
heapster已经被官方废弃(k8s 1.11版本中,HPA已经不再从hepaster获取数据)
CPU内存、HPA指标: 改为metrics-server 基础监控:集成到prometheus中,kubelet将metric信息暴露成prometheus需要的格式,使用Prometheus Operator 事件监控:集成到heptiolabs/eventrouter
架构图
报警
- Prometheus Aler:开源的运维告警中心消息转发系统,支持主流的监控系统Prometheus,日志系统Graylog和数据可视化系统Grafana发出的预警消息,支持钉钉,微信,华为云短信,腾讯云短信,腾讯云电话,阿里云短信,阿里云电话等
- prymitive/karma: Alert dashboard for Prometheus Alertmanager
Event
监控工具
- SigNoz/signoz: SigNoz helps developers monitor their applications & troubleshoot problems, an open-source alternative to DataDog, NewRelic, etc. 🔥 🖥 2、abahmed/kwatch: monitor & detect crashes in your Kubernetes(K8s) cluster instantly
node检测
- 参考node problem detector
- Prometheus exporter for hardware and os metrics:Prometheus exporter for hardware and OS metrics exposed by *NIX kernels, written in Go with pluggable metric collectors.
- cloudflare/sciuro: Alertmanager to Kubernetes Node conditions bridge
变更管理
- watch-proxy:sits in your Kubernetes cluster and watches resources you care about, then tells you when they are created, changed or deleted.
理解kubernates
- octant:is a tool for developers to understand how applications run on a Kubernetes cluster 2.sonobuoy:is a diagnostic tool that makes it easier to understand the state of a Kubernetes cluster by running a set of Kubernetes conformance tests and other plugins in an accessible and non-destructive manner 3.Crash-Diagnostics:a tool to help investigate, analyze, and troubleshoot unresponsive or crashed Kubernetes clusters.
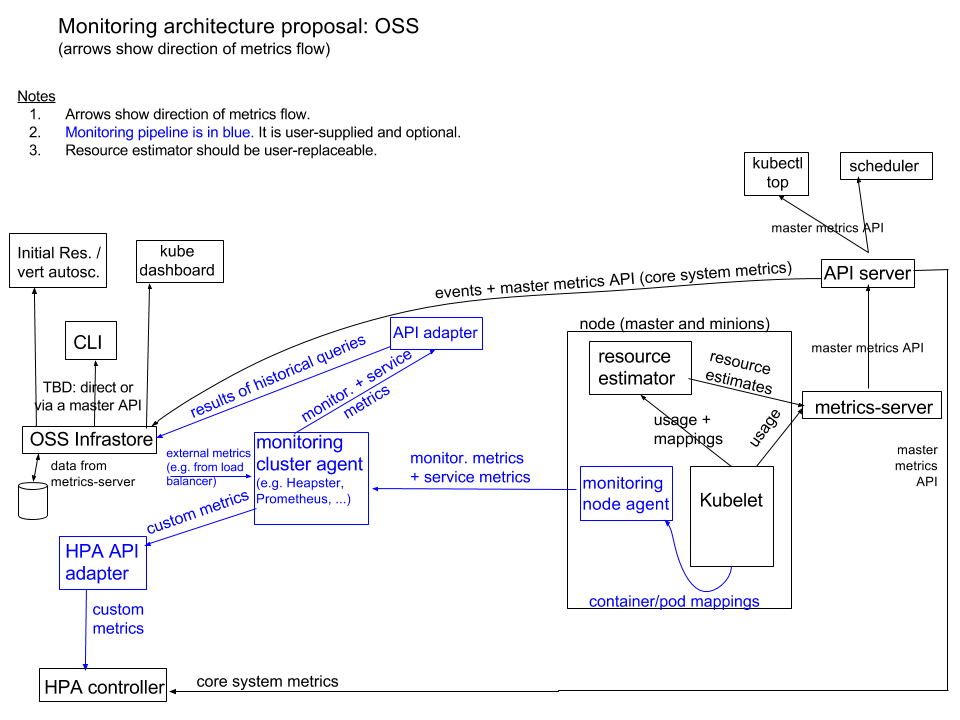
- Kubernetes monitoring architecture
- 容器监控实践—Heapster
- Prometheus Operator 学习笔记
- Prometheus Operator 的安装
- Monitoring Kubernetes Jobs. How to monitor Kubernetes Jobs using… | by Matías Costa | ITNEXT

Kubernates 对外提供服务
介绍
K8s对外提供服务,提供了NodePort, LoadBalance, Ingress ClusterIP: 默认方式。根据是否生成ClusterIP又可分为普通Service和Headless Service两类: 普通Service:通过为Kubernetes的Service分配一个集群内部可访问的固定虚拟IP(Cluster IP),实现集群内的访问。为最常见的方式。 Headless Service:该服务不会分配Cluster IP,也不通过kube-proxy做反向代理和负载均衡。而是通过DNS提供稳定的网络ID来访问,DNS会将headless service的后端直接解析为podIP列表。主要供StatefulSet使用。 NodePort:除了使用Cluster IP之外,还通过将service的port映射到集群内每个节点的相同一个端口,实现通过nodeIP:nodePort从集群外访问服务。 LoadBalancer:和nodePort类似,不过除了使用一个Cluster IP和nodePort之外,还会向所使用的公有云申请一个负载均衡器(负载均衡器后端映射到各节点的nodePort),实现从集群外通过LB访问服务。 ExternalName:是 Service 的特例。此模式主要面向运行在集群外部的服务,通过它可以将外部服务映射进k8s集群,且具备k8s内服务的一些特征(如具备namespace等属性),来为集群内部提供服务。此模式要求kube-dns的版本为1.7或以上。这种模式和前三种模式(除headless service)最大的不同是重定向依赖的是dns层次,而不是通过kube-proxy。
功能
- Metallb:贫苦 K8S 用户的负载均衡支持
- Traefik: 一个为了让部署微服务更加便捷而诞生的现代HTTP反向代理、负载均衡工具。 它支持多种后台(Docker, Swarm, Kubernetes, Marathon, Mesos, Consul, Etcd, Zookeeper, BoltDB, Rest API, file…) 来自动化、动态的应用它的配置文件设置。
- mergeable-ingress-types:跨域名的ingress支持
- inlets/inlets-operator: Add public LoadBalancers to your local Kubernetes clusters
Ingress
 Ingress Builder
Why and How of Kubernetes Ingress (and Networking) | by getenroute.io/yastack.io | ITNEXT
Ingress Builder
Why and How of Kubernetes Ingress (and Networking) | by getenroute.io/yastack.io | ITNEXT
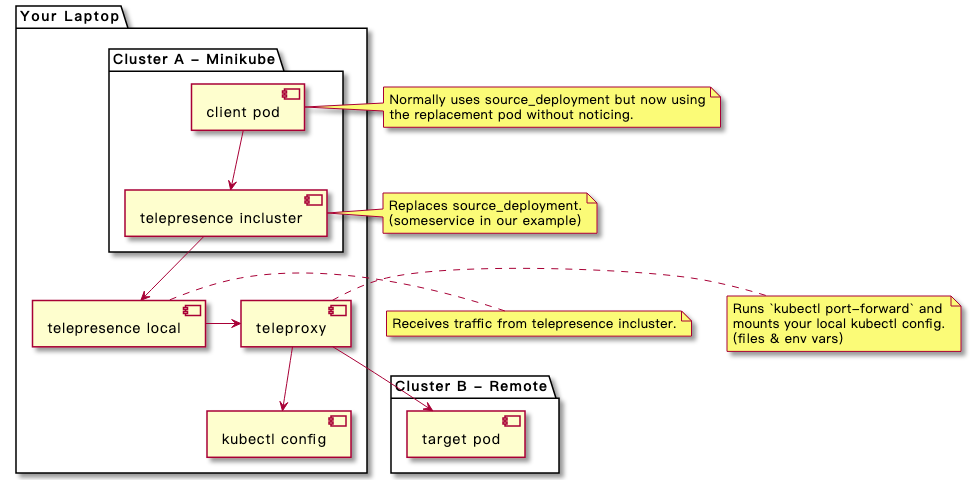
构建隧道
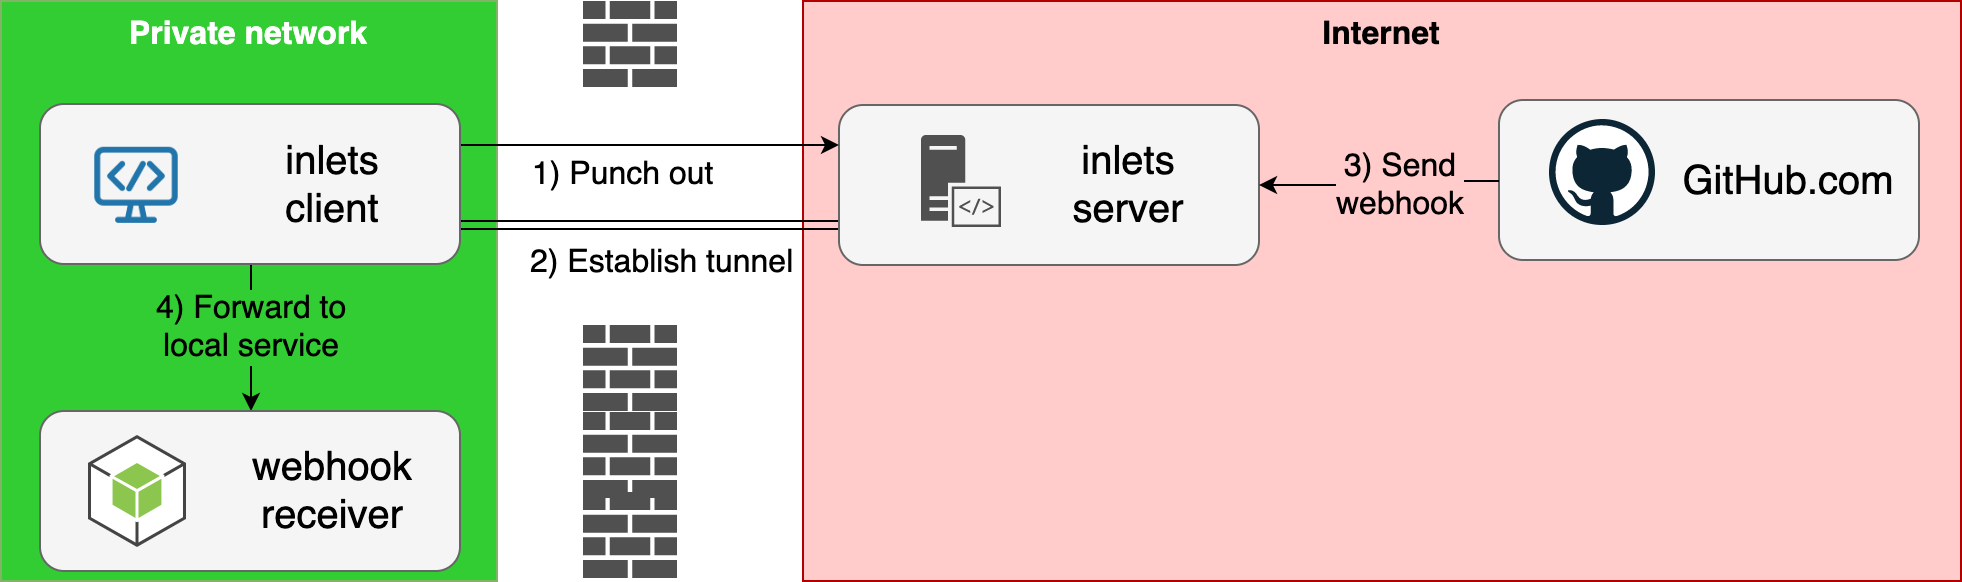
访问外部服务

Ingress
网络整断
网络调试
原理
- How Do Kubernetes and Docker Create IP Addresses?! | Dustin Specker
- iptables: How Kubernetes Services Direct Traffic to Pods | Dustin Specker
dns
ori-edge/k8s_gateway: A CoreDNS plugin to resolve all types of external Kubernetes resources
vpn
Guide: Setting up a Tailscale VPN on Kubernetes fatedier/frp: A fast reverse proxy to help you expose a local server behind a NAT or firewall to the internet.
参考
- Metallb - 贫苦 K8S 用户的负载均衡支持
- metallb
- 解决非公有云上的kubernetes 不支持 LoadBalancers 模式的service
- k8s ingress原理及ingress-nginx部署测试 4.来自骷髅岛的 Ingress Controller:Kong
- Kube:使用IPVS和External IP对K8S集群进行外部负载均衡
- k8s pod的4种网络模式最佳实战(externalIPs )
- [kubernetes service外部网络访问方式](https://blog.csdn.net/oguro/article/details/89565116)
- k8s记录-使用kube-proxy让外部网络访问K8S service的ClusterIP
- 实操教程丨如何在K8S集群中部署Traefik Ingress Controller
- Traefik-v2.x快速入门
- traefik io官方文档
- traefik和nginx区别
- Kubernetes 学习笔记(六)--- Ingress
- 使用 Kubernetes Ingress 对外暴露服务
- Get a LoadBalancer for your private Kubernetes cluster
- Learn how to use Kubernetes External IP service type
- Istio Ingress vs. Kubernetes Ingress – Daniel Watrous on Software and Cloud Engineering
- Kubernetes Ingress — Simplified · Scaleout Ninja | by Richard Pablo | The Startup | Medium
- Kubernetes: what are Endpoints. Usually, we don’t see Endpoints objects… | by Arseny Zinchenko (setevoy) | ITNEXT
- Stateless Kubernetes overlay networks with IPv6
- Comparing kube-proxy modes: iptables or IPVS? – Project Calico
Kubernetes网络
CNI
首先我们介绍一下什么是 CNI,它的全称是 Container Network Interface,即容器网络的 API 接口。
它是 K8s 中标准的一个调用网络实现的接口。Kubelet 通过这个标准的 API 来调用不同的网络插件以实现不同的网络配置方式,实现了这个接口的就是 CNI 插件,它实现了一系列的 CNI API 接口。常见的 CNI 插件包括 Calico、flannel、Terway、Weave Net 以及 Contiv。
如何使用CNI
K8s 通过 CNI 配置文件来决定使用什么 CNI。
基本的使用方法为:
首先在每个结点上配置 CNI 配置文件(/etc/cni/net.d/xxnet.conf),其中 xxnet.conf 是某一个网络配置文件的名称;
安装 CNI 配置文件中所对应的二进制插件;
在这个节点上创建 Pod 之后,Kubelet 就会根据 CNI 配置文件执行前两步所安装的 CNI 插件;
上步执行完之后,Pod 的网络就配置完成了。

CNI 插件

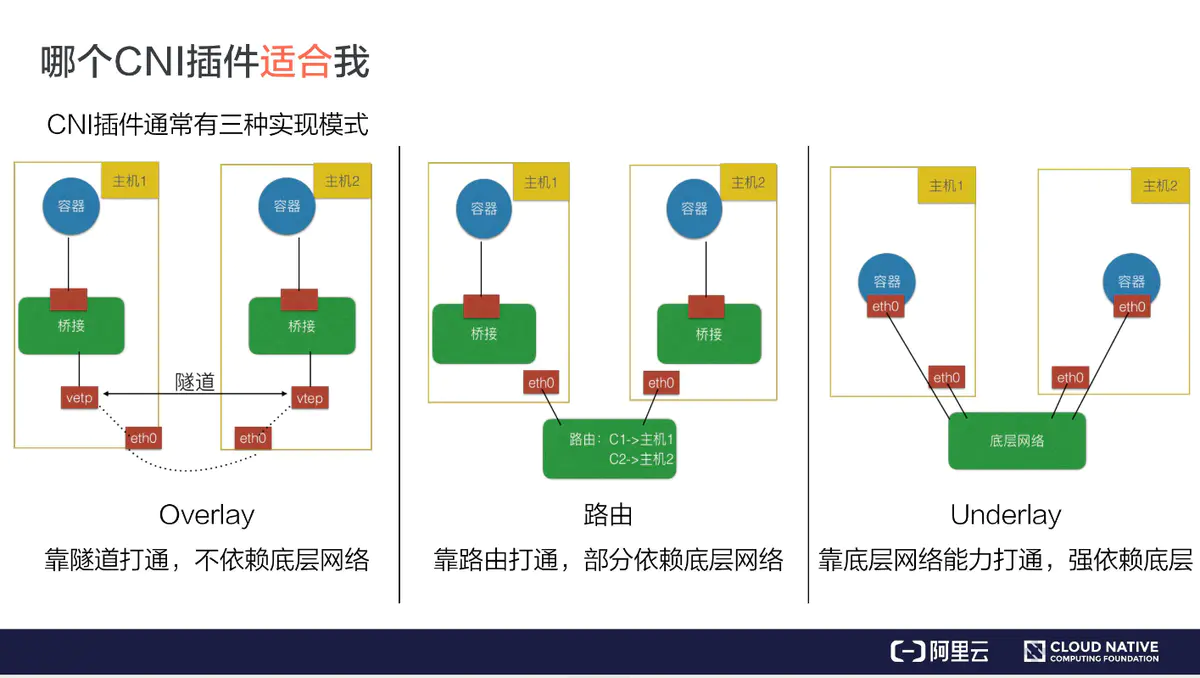
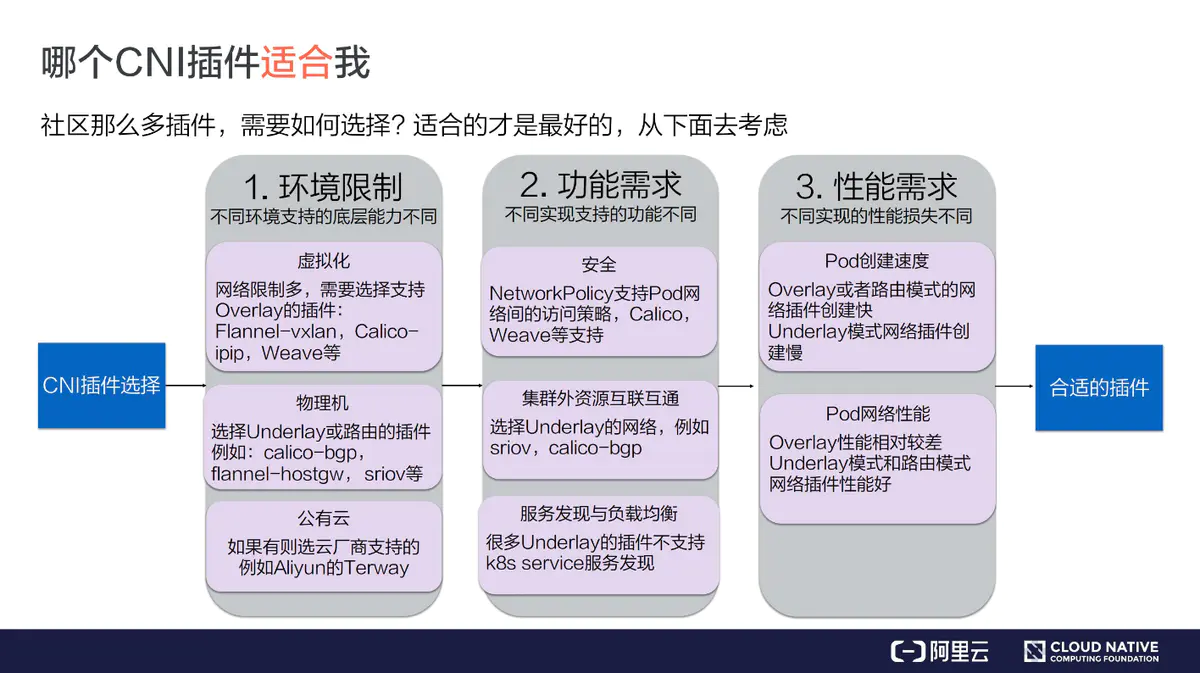
Overlay 模式的典型特征是容器独立于主机的 IP 段,这个 IP 段进行跨主机网络通信时是通过在主机之间创建隧道的方式,将整个容器网段的包全都封装成底层的物理网络中主机之间的包。该方式的好处在于它不依赖于底层网络;
路由模式中主机和容器也分属不同的网段,它与 Overlay 模式的主要区别在于它的跨主机通信是通过路由打通,无需在不同主机之间做一个隧道封包。但路由打通就需要部分依赖于底层网络,比如说要求底层网络有二层可达的一个能力;
Underlay 模式中容器和宿主机位于同一层网络,两者拥有相同的地位。容器之间网络的打通主要依靠于底层网络。因此该模式是强依赖于底层能力的。
那个插件适合我

网络策略
1、VxLan 2、BGP 3、IPIP
多CNI适配插件
网络解决方案
- antrea:Antrea is a Kubernetes networking solution intended to be Kubernetes native. It operates at Layer3/4 to provide networking and security services for a Kubernetes cluster, leveraging Open vSwitch as the networking data plane.
DNS
网络
-
pod 内部

-
同主机pod之间

-
不同主机pod之间
ipvs和iptables
Comparing kube-proxy modes: iptables or IPVS? – Project Calico
参考
- 浅谈K8s的服务发现
- k8s之Ingress工作原理
- k8s服务暴露之ingress与负载均衡
- Kubernetes 网络疑难杂症排查分享
- Understanding kubernetes networking: pods
- Understanding kubernetes networking: services
- Understanding kubernetes networking: Ingress
- cilium:HTTP, gRPC, and Kafka Aware Security and Networking for Containers with BPF and XDP
- [Kubernetes服务发现入门:如何高效管理服务?](https://www.cnblogs.com/rancherlabs/p/12071889.html)
- kubernetes中pod间的通信
- 从零开始入门 K8s | 理解 CNI 和 CNI 插件
- calico:实现多租户下的网络隔离
- 图解k8s网络
- https://www.digitalocean.com/community/tutorials/kubernetes-networking-under-the-hood#conclusion
- 玩转Kubernetes网络
- https://matthewpalmer.net/kubernetes-app-developer/articles/kubernetes-networking-guide-beginners.html
Kubectl 操作docker
覆盖EntryPoint和CMD
apiVersion: v1
kind: Pod
metadata:
  name: command-demo
  labels:
    purpose: demonstrate-command
spec:
  containers:
  - name: command-demo-container
    image: debian
    command: ["printenv"]
    args: ["HOSTNAME", "KUBERNETES_PORT"]
  restartPolicy: OnFailure
| Description | Docker field name | Kubernetes field name |
|---|---|---|
| The command run by the container | Entrypoint | command |
| The arguments passed to the command | Cmd 女名女子名 | args |
功能覆盖对照表:
| mage Entrypoint | Image Cmd | Container command | Container args | Command run |
|---|---|---|---|---|
| [/ep-1] | [foo bar] | [ep-1 foo bar] | ||
| [/ep-1] | [foo bar] | [/ep-2] | [ep-2] | |
| [/ep-1] | [foo bar] | [zoo boo] | [ep-1 zoo boo] | |
| [/ep-1] | [foo bar] | [/ep-2] | [zoo boo] | [ep-2 zoo boo] |
参考
- Kubernetes 访问 docker 仓库失败 no basic auth credentials
- docker的Cgroup Driver和kubelet的Cgroup Driver不一致
- 从零开始入门 K8s | 详解 K8s 容器基本概念
kubernetes Service
概念
Service是Kubernetes的核心资源类型之一,Service资源基于标签选择器将一组Pod定义成一个逻辑组合,并通过自己的IP地址和端口调度代理请求到组内的Pod对象,如下图所示,它向客户端隐藏了真是的,处理用户请求的Pod资源,使得从客户端上看,就像是由Service直接处理并响应一样
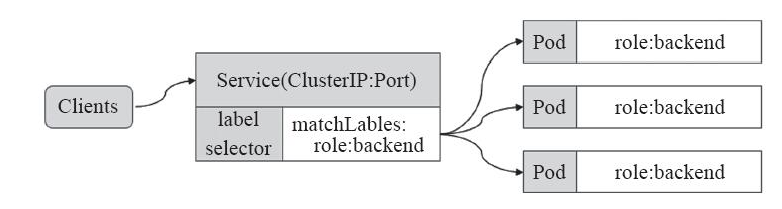
service 做了什么?
- 暴露pod 2.它还可以在多个Pod间负载均衡
原理
是宿主机的kube-proxy生成的iptables规则 ,及kube-dns生成的DNS记录
参考
- kubernetes Service详解
- 浅谈K8s的服务发现
- k8s之Ingress工作原理
- k8s服务暴露之ingress与负载均衡
- 入门级实操教程!从概念到部署,全方位了解K8S Ingress!
- Kubernetes学习之路(十四)之服务发现Service
- Service详细描述
- k8s pod的4种网络模式最佳实战(externalIPs )
- Kubernetes的Service运行原理
- Learn how to use Kubernetes External IP service type
Kubernetes 概念和术语
参考
- Kubernetes概念与术语
- K8S集群入门:运行一个应用程序究竟需要多少集群
- kubernetes-architecture
- Kubernetes的设计理念
- Kubernetes- Features -
- Kubernetes Concepts and Architecture | Platform9
- Proof of Concept: SAP on Kubernetes – Deployment, Application scaling scenarios | SAP Blogs
- The Kubernetes Aquarium. A tour through the containers of fishes… | by Anne LoVerso | Medium
Kubernetes Sidecars
example
apiVersion: v1
kind: Pod
metadata:
  name: nginx
spec:
  shareProcessNamespace: true
  containers:
  - name: nginx
    image: nginx
  - name: shell
    image: busybox
    securityContext:
      capabilities:
        add:
        - SYS_PTRACE
    stdin: true
    tty: true
- shareProcessNamespace: 容许不同的pod之间能够看到相互的进程
- SYS_PTRACE: 容许发送 SIGHUP 信号到其他pod进程。 同时可以通过/proc/$pid/root 访问其他的进程
- 当然也可以通过公用磁盘卷来完成共享
参考
- Kubernetes 中用 Sidecar 为应用添加 Oauth 功能
- Share Process Namespace between Containers in a Pod | Kubernetes
Kubernates 安全
安全框架
- astrolabe:Data protection framework for complex applications
参考
- Krew 插件:view-secret
- 安全扫描:KubeSec-Scan
- Kubernates 33个安全扫描工具
- Kubeseal:秘钥是生成的安全工具
- 管理机密信息
- 11 Ways (Not) to Get Hacked
其他
学习课程
资源
- 伪架构师
- 祁恩达: k8s笔记
- k8s笔记
- k8s学习笔记
- unofficial k8s docs
- betz.mark: blog
- liumiaocn blog
- linux运维之路
- 微服务开发案例
- 超级小豆丁
- 努力&小白:随笔分类
- servicemesher
- k8s学习笔记\
- 陪天王k8s笔记
- awesome-cloud-native
- k8s资源对象
- Tony Bai 博客
- Fernando Diaz – Medium
- Kubernetes | Wener Live & Life
Kubernates 管理
root磁盘不够,docker镜像丢失了
k8s 在磁盘不够的时候,默认会自动清理镜像
磁盘容量足够,但是k8s仍然有好多处于evicted
如何修改docker和k8s相关数据到volume
k8s会检查nodefs和imagefs, 其中imagefs 检测 /var/lib/docker所在的磁盘符, nodefs,检测/var/lib/kublet所在的盘符, nodefs 可以通过使用kubectl --root-dir来完成
node status's Ready,SchedulingDisabled
kubectl uncordon
磁盘容量规划
- Configure Out of Resource Handling
- Reserve Compute Resources for System Daemons
- Node Allocatable Resources
- Kubernetes资源管理之--资源预留
参考
- k8s Garbage Collections
- node get DiskPressure when disk space is still plenty
- k8s out of Resource
- Understanding Kubernates pod evicted
- how to deal with pod evicted
- Running out of disk space but no warnings from `kubectl describe nodes
- My worker node status is Ready,SchedulingDisabled
kubernetes 排错
pod 排错
pod排错方法
- 查看配置是否正确
kubectl get pod <pod-name> -o yaml
- 查看 Pod 的事件
kubectl describe pod <pod-name>
- 查看pod 日志
kubectl logs <pod-name> [-c <container-name>]
常见pod 异常状态处理
- pod 一直处理Pending状态
- pod 一直处理waiting状态
- pod处于ImagePullBackOff状态
- pod一直处于crashLoopBack
- pod 处于Error状态
- pod 处于Terminating 或者 Unkown状态
- pod行为异常
- 修改静态pod 后Manifest 后未自动重建
service 排错
Replication Controllers排错
参考
Kubernetes Kubelet
介绍
kubelet 是运行在每个节点上的主要的“节点代理”,它按照 PodSpec 中的描述工作。 PodSpec 是用来描述一个 pod 的 YAML 或者 JSON 对象。kubelet 通过各种机制(主要通过 apiserver )获取一组 PodSpec 并保证在这些 PodSpec 中描述的容器健康运行。kubelet 不管理不是由 Kubernetes 创建的容器。
除了来自 apiserver 的 PodSpec ,还有 3 种方式可以将容器清单提供给 kubelet 。
文件:在命令行指定的一个路径,在这个路径下的文件将被周期性的监视更新,默认监视周期是 20 秒并可以通过参数配置。
HTTP端点:在命令行指定的一个HTTP端点,该端点每 20 秒被检查一次并且可以通过参数配置检查周期。
HTTP服务:kubelet 还可以监听 HTTP 服务并响应一个简单的 API 来创建一个新的清单。
参考
- kubelet手册: 中文
- kubelet的启动参数修改
- kubelet最佳配置
- kubelet how to protect node stability
- Kubernetes之kubectl常用命令使用指南:1:创建和删除
Kubectl
介绍
什么是kubectl ?
kubectl是Kubernetes API的客户端, 可以和kubernetes API Server沟通,完成对kubernetes的相关操作

常用命令
| 命令 | 说明 |
|---|---|
| run | 在集群上运行一个镜像 |
| create | 使用文件或者标准输入的方式创建一个资源 |
| delete | 使用文件或者标准输入以及资源名称或者标签选择器来删除某个资源 |
| version | 显示客户端和服务器侧版本信息 |
| api-versions | 以group/version的格式显示服务器侧所支持的API版本 |
| explain | 显示资源文档信息 |
| get | 取得确认对象信息列表 |
| describe | 取得确认对象的详细信息 |
| logs | 取得pod中容器的log信息 |
| exec | 在容器中执行一条命令 |
| cp | 从容器考出或向容器考入文件 |
| attach | Attach到一个运行中的容器上 |
| edit | 编辑服务器侧资源 |
| replace | 使用文件名或者标准输入资源 |
| patch | 部分更新资源相关信息 |
| apply | 使用文件或者标准输入更改配置信息 |
| scale | 重新设定Deployment/ReplicaSet/RC/Job的size |
| autoscale | Deployment/ReplicaSet/RC的自动扩展设定 |
| cordon | 设定node不可使用 |
| uncordon | 设定node可以使用 |
| drain | 设定node进入维护模式 |
内部原理
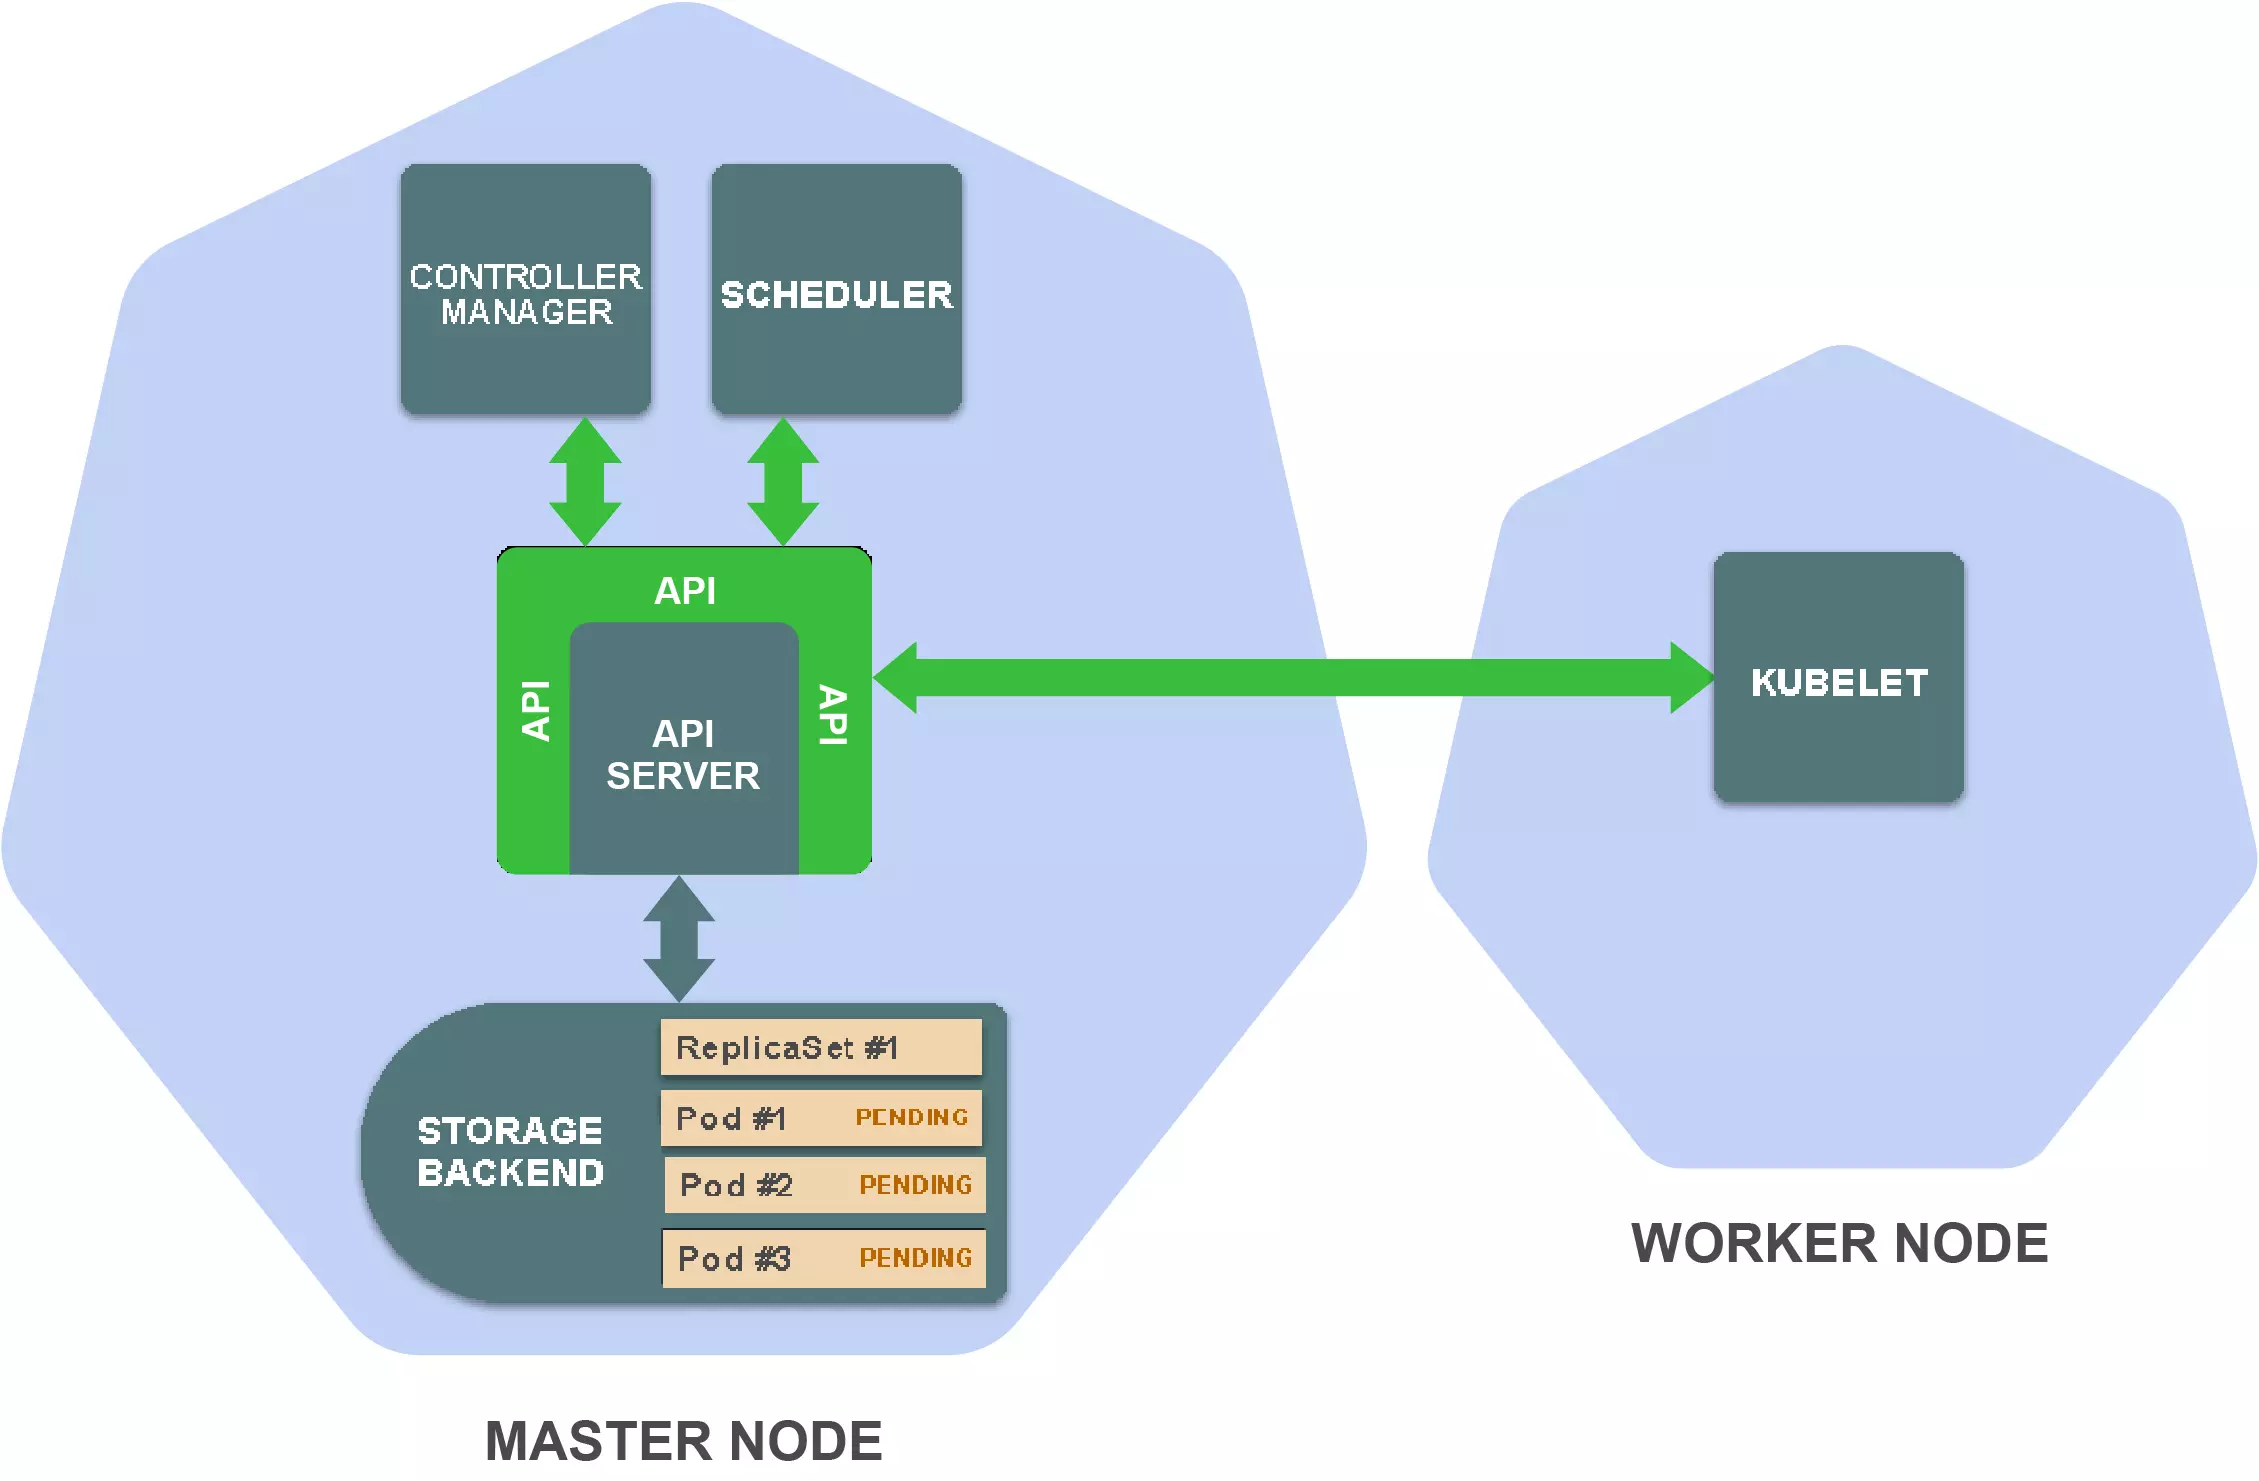
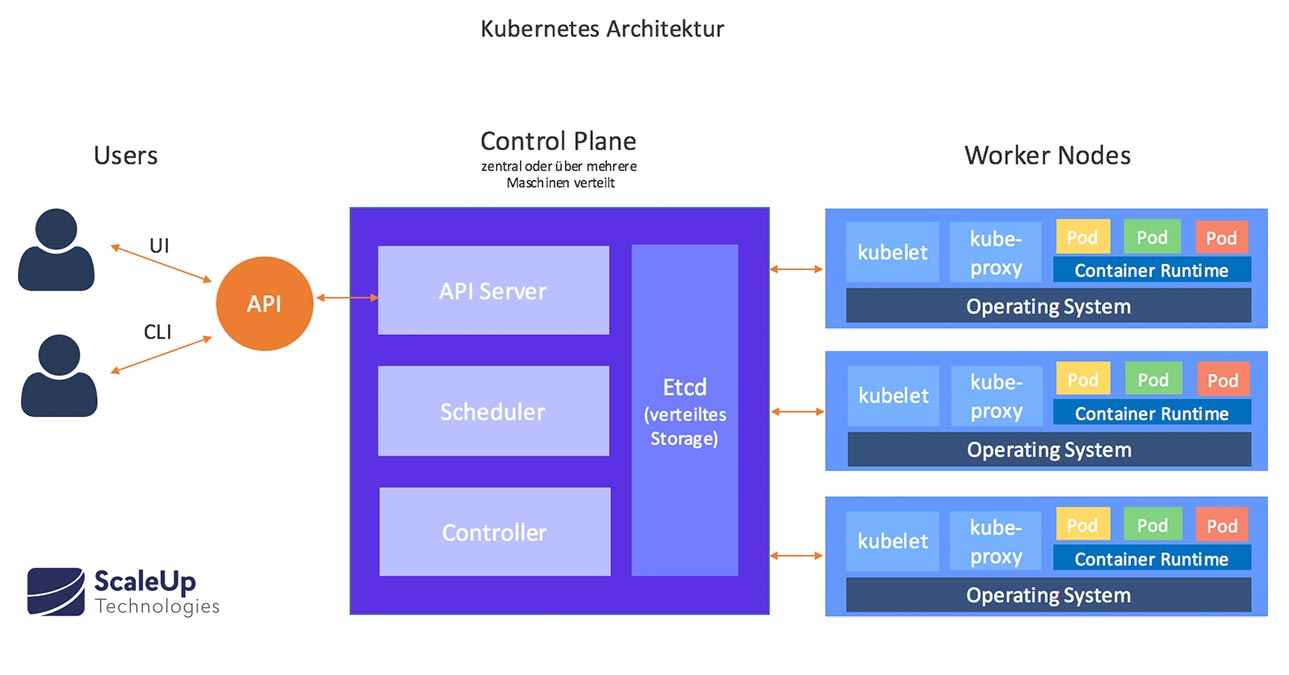
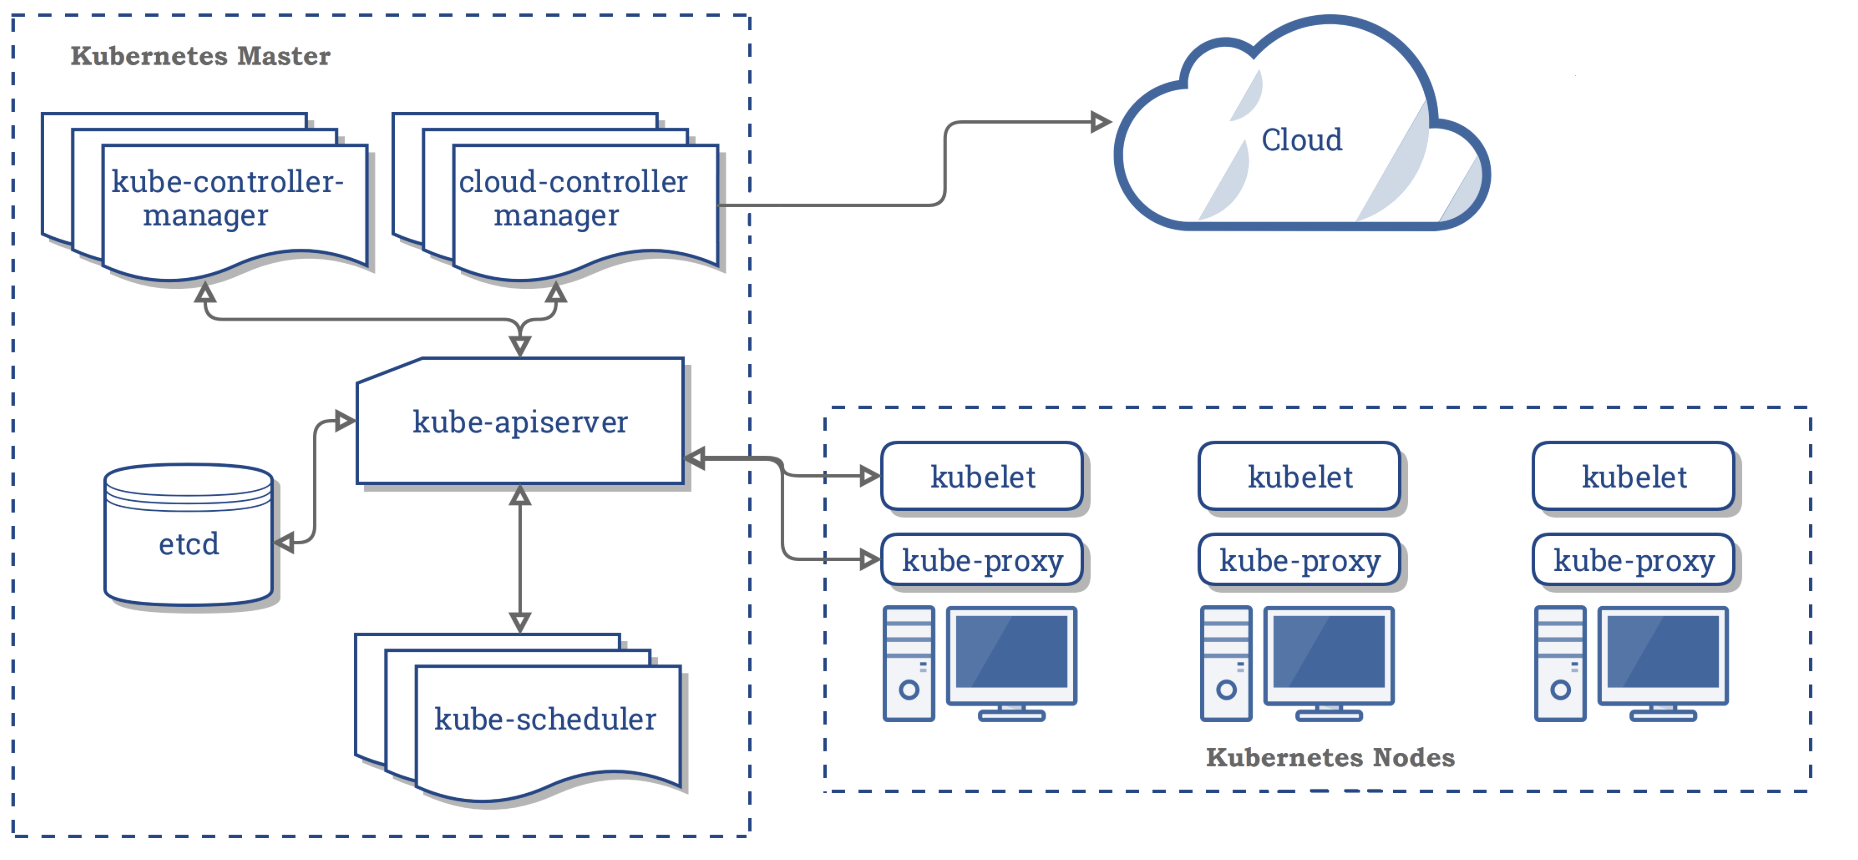
kubernate的内部组成
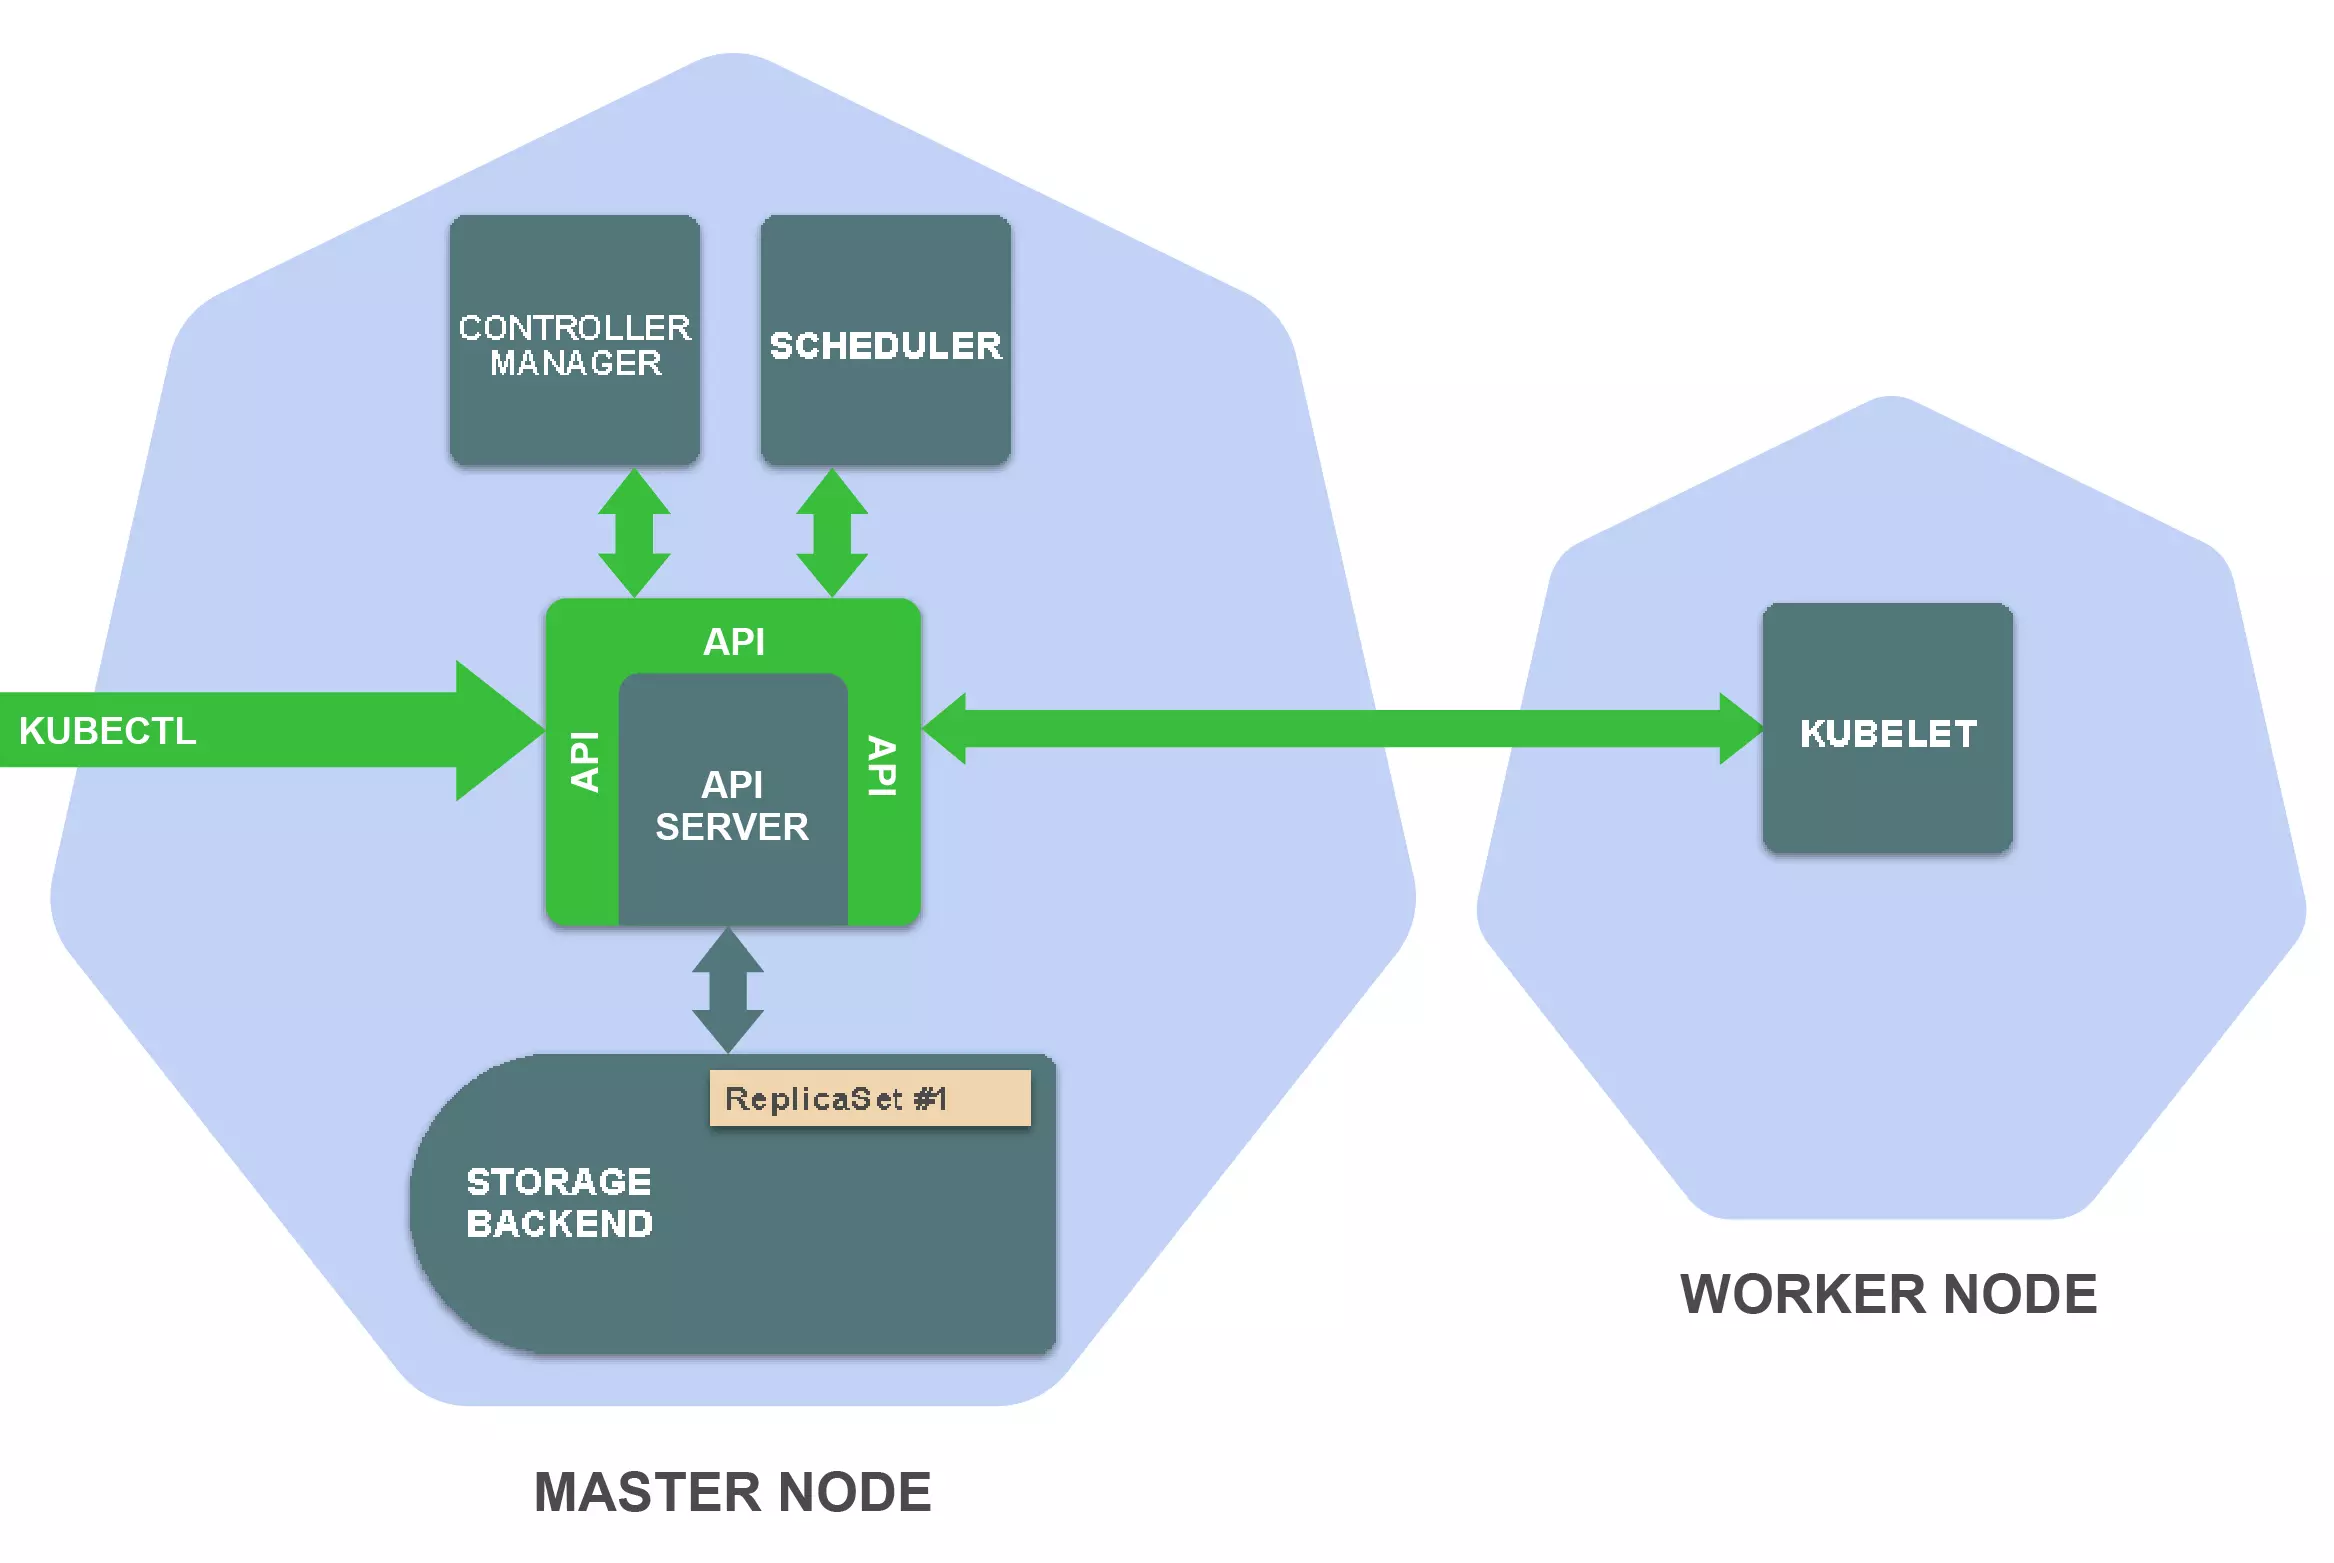
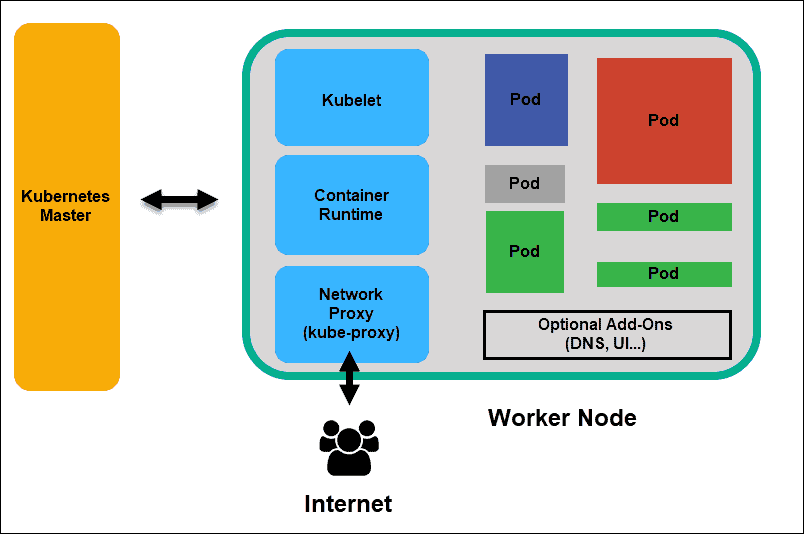
Kubernetes由一系列独立组件构成,这些组件会在集群的节点上作为单独的进程运行。一些组件运行在master节点,一些组件运行在worker节点,每个组件都有其特定功能。
在master节点上,有以下重要组件:
存储后端:存储资源定义(通常使用etcd)
API Server:提供Kubernetes API并管理存储后端
Controller manager:确保资源状态与规范相匹配
Scheduler:将Pod调度到worker节点
在worker节点上最重要的组件为:
Kubelet:在worker节点上管理容器的执行
理解kubectl 基本操作原理
假如执行下面的语句
kubectl create -f replicaset.yaml
kubectl向_create ReplicaSet API端点_发出了HTTP POST请求, 发送replicaset资源的定义,然后API Server 保存相关定义
 后台Controller Manager 中的ReplicaSet Controller 会扫描 RelicaSet资源的变化,然后去创建三个pod资源
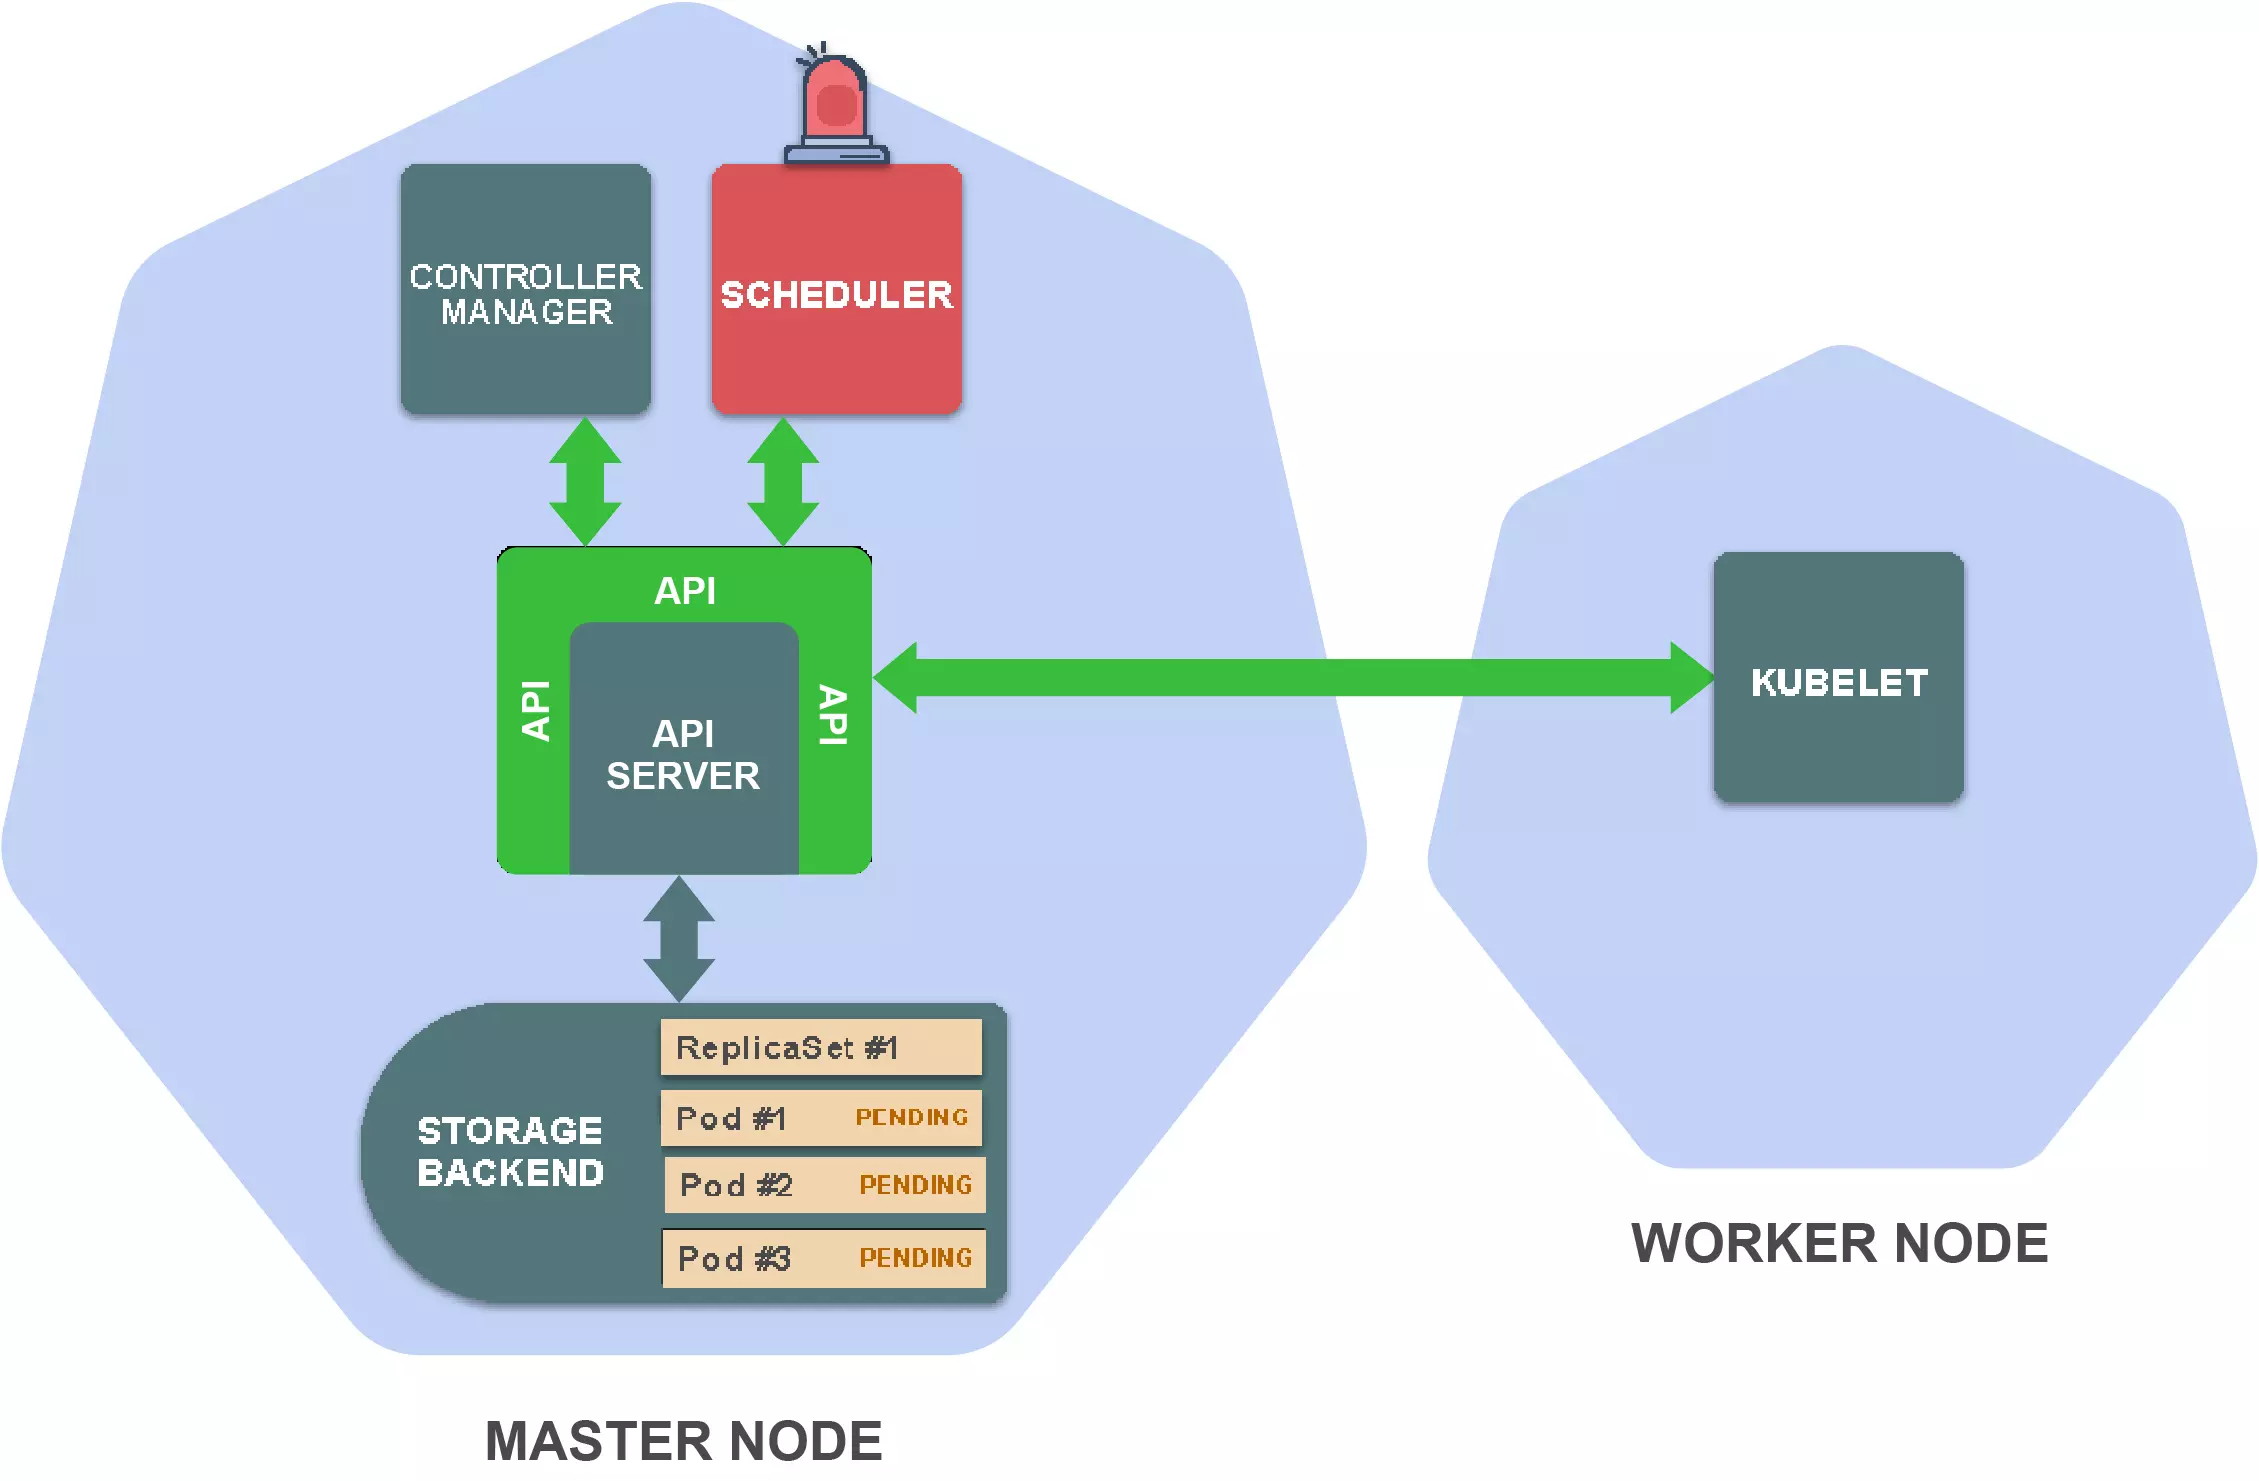
 这时候scheduler 会监控woker中未分配的pod,然后选择合适的worker节点,存储相对应的信息到pod定义中
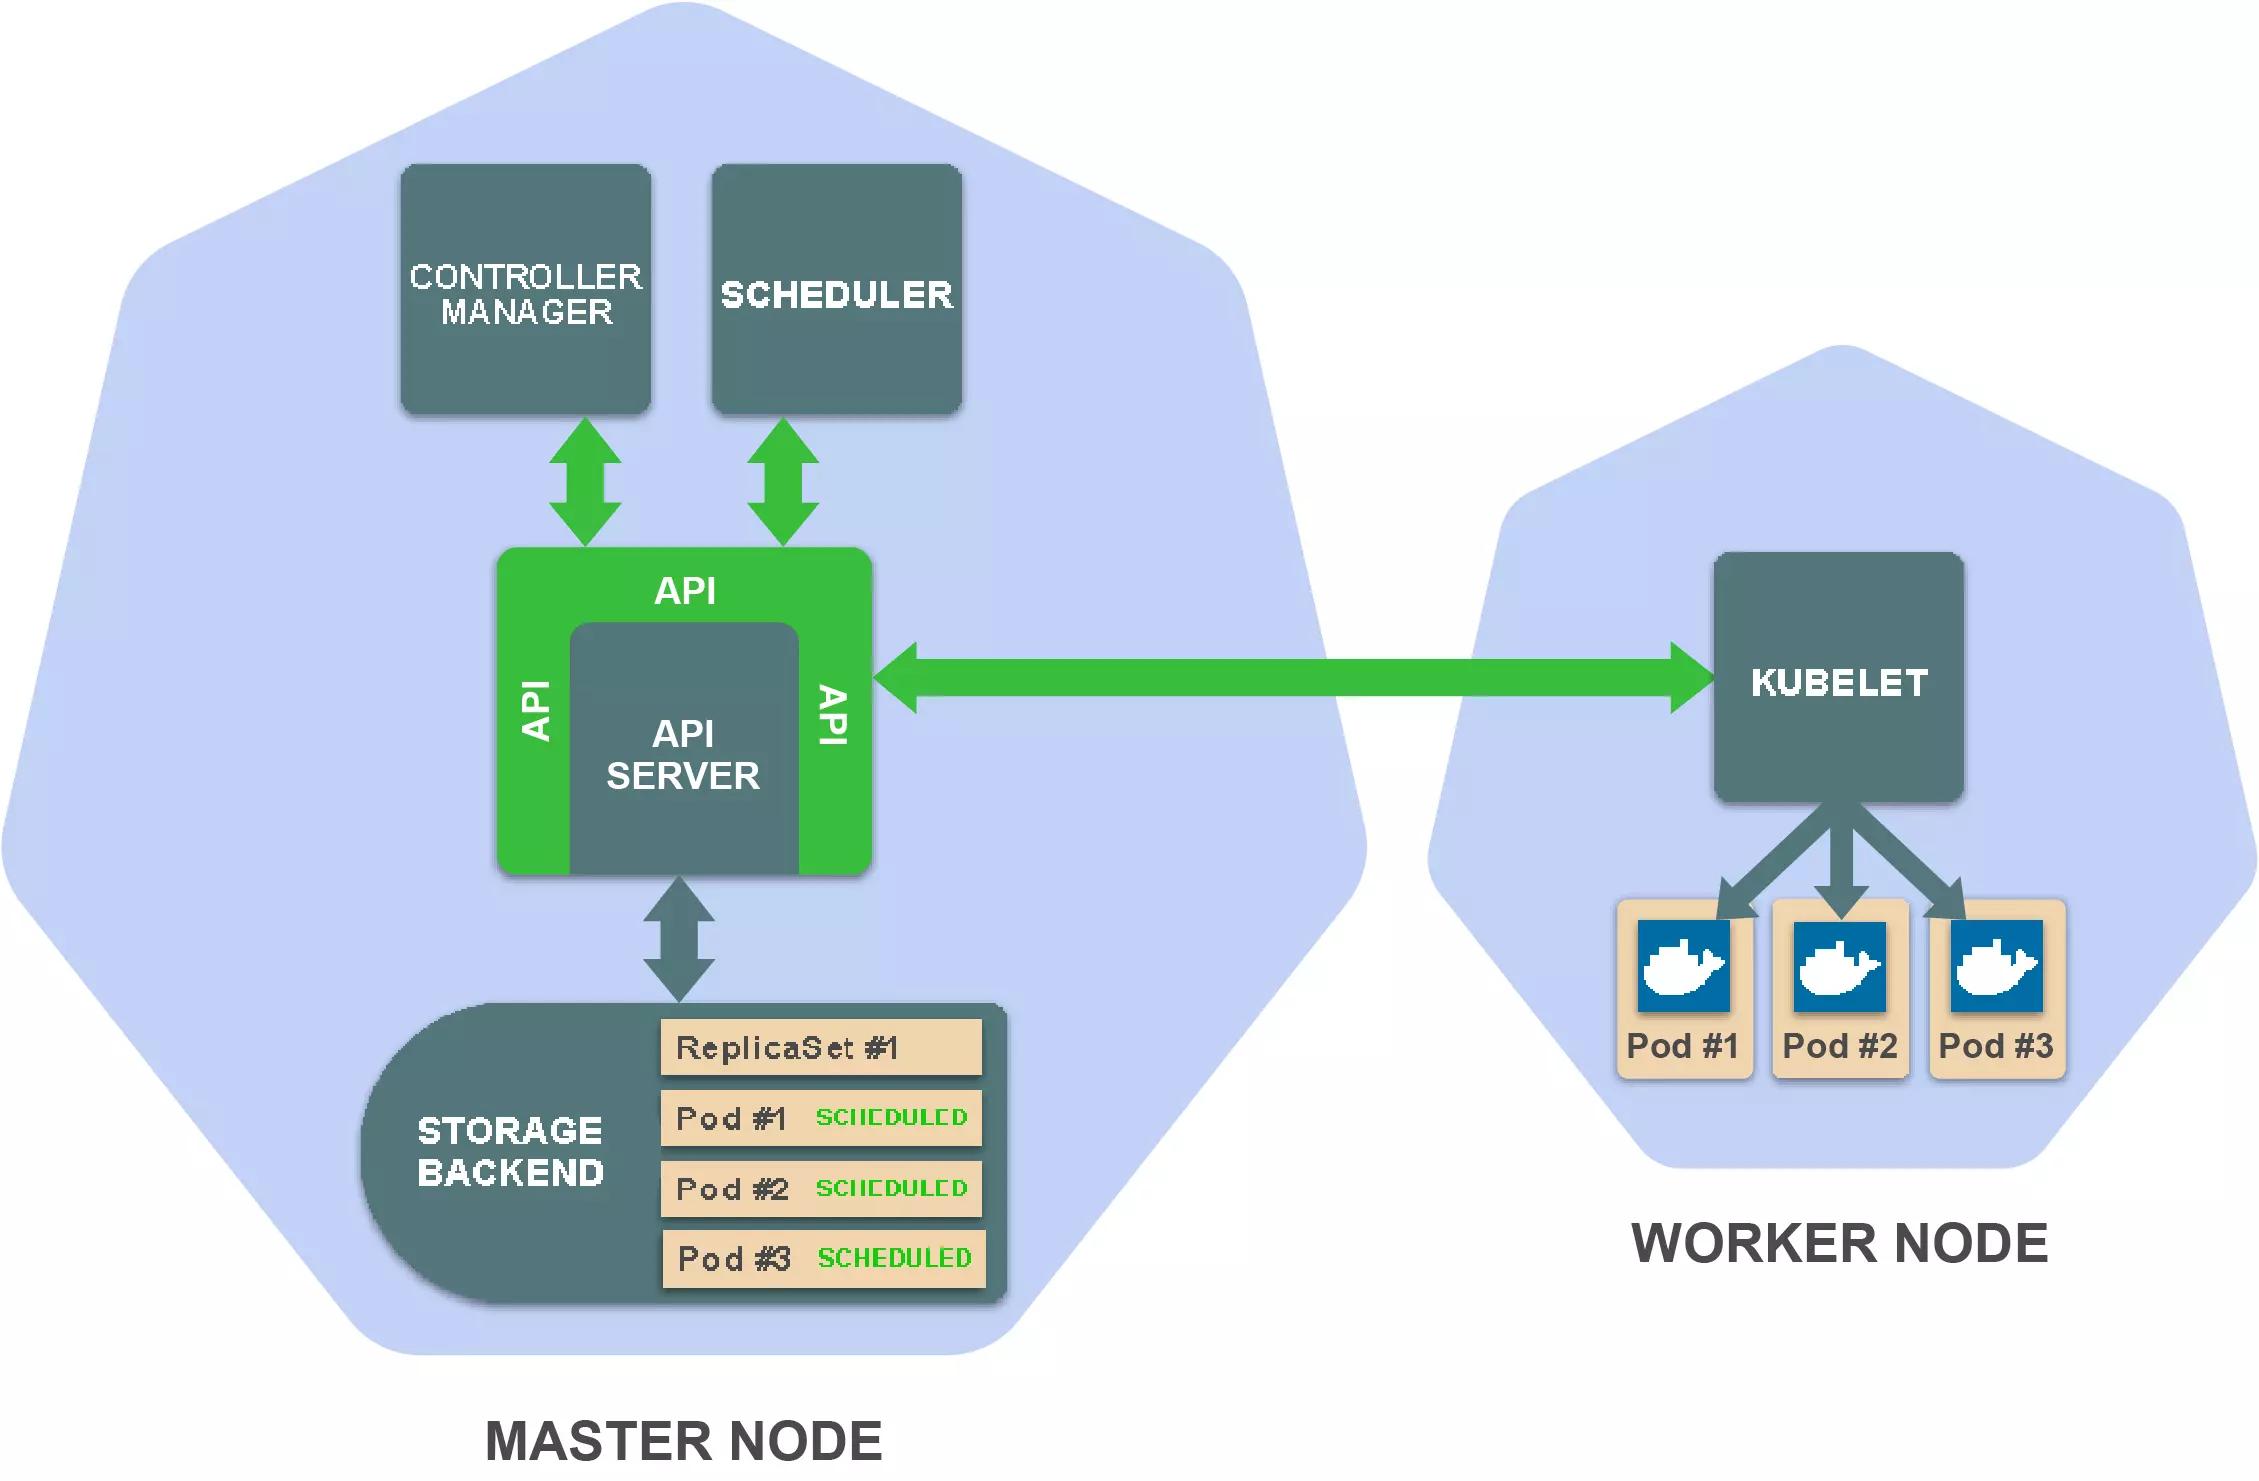
 然后对应woker的kubelet会扫描对应pod资源的变化
 去获取pod的定义,调用容器runtime,来运行容器,最终我们看到
kubernetes 基本工作原理
1、kuberetes的所有组件都是资源,后端存储(etcd)维护了资源的状态 2、对资源的操作,必须通过API来完成 3、其他组件也是通过API来监控资源的变化,然后出发响应的操作的
使用技巧
1. 自动补全
2. 迅速查看资源规范
官方文档位于1.13 doc, 但是会十分繁琐,kubectl explain命令专门用于解决这个问题, 基本格式如下
kubectl explain resource\[.field\] [--recursive] # 默认命令展示一层 recursive可以显示所有级别
如果不确定有哪些资源,使用
kubectl api-resources
使用例子
kubectl explain deployments.spec
# or
kubectl explain deployment.spec
# or
kubectl explain deploy.spec
3. 自定义列输出格式
4. 轻松在集群和命名空间之间切换
5. 时候用自动生成的别名保存输入
6. 使用插件扩展kubectl
插件介绍
- kubepug:一个 kubectl 插件,可以在集群升级之前对集群进行扫描,如果有集群中存在着在目标版本中废弃或者删除的资源,则会给出相应的警告。
- kind
- kubectl-tree:该插件提供 K8s 资源对象的归属关系,通过 K8s 对象的 ownerReferencesfield 可以知道某个对象的 owner,以此能够花痴一个对象的 owner ref 的族谱。
- predatorray/kubectl-tmux-exec: A kubectl plugin to control multiple pods simultaneously using Tmux
kubectl 替代工具
- Kubelive:一款小工具,可以实时交互式的方式去查看和操作 K8s 的资源对象,目前支持 Pod 关联的对象。 需要nodejs

参考
- 万字硬核干货!6大技巧,极速提升kubectl的生产力!
- Kubernetes之kubectl常用命令使用指南:2:故障排查
- Kubernetes之kubectl常用命令使用指南:3:故障对应
- http://docs.kubernetes.org.cn/683.html
- kubectl技巧之查看资源列表,资源版本和资源schema配置
- how to stop/pause a pod in kubernetes
- 使用Kubectl管理Kubernetes的全解教程
- feloy/kubectl-reference: This tool creates a DocBook documentation from the Kubectl inline help
kubernetes 存储
CSI
Persist Volumes
- K8S Manual:Persistent Volumes
- KUBERNETES存储之PERSISTENT VOLUMES简介
- kubernetes(k8s)PV的使用
- 【K8S】k8s pv,pvc无法删除问题
- Kubernetes PV在Retain策略Released状态下重新分配到PVC恢复数据
Persist Volume Declare
持久化存储
- Longhorn: Cloud-Native distributed block storage built on and for Kubernetes. open source by rancher
问题
- k8s pv,pvc无法删除问题
- [CentOS / RHEL 7 : Configuring an NFS server and NFS client]( https://www.thegeekdiary.com/centos-rhel-7-configuring-an-nfs-server-and-nfs-client)
NFS
- kubernetes 使用 nfs作为存储
- k8s实用整理(18)-k8s存储之NFS
- kubernetes梳理
- kubernetes-sigs/nfs-subdir-external-provisioner: Dynamic sub-dir volume provisioner on a remote NFS server.
存储选项查看
glusfer
性能检测
存储容量限制
参考
- Longhorn入门级教程!轻松实现持久化存储!
- k8s日志收集-多pod挂载不同目录方案
- 从零开始入门 K8s:应用存储和持久化数据卷的核心知识
- 从零开始入门 K8s:应用存储和持久化数据卷:存储快照与拓扑调度
- Kubernetes Volumes: the definitive guide (Part 2)
- k8s的pv和pvc概念
- 使用NAS静态存储卷 - 容器服务Kubernetes版 - 阿里云
- Configuring Local Volumes | Configuring Clusters | OpenShift Container Platform 3.11
- Configuring local storage - IBM Documentation
Service Mesh
参考
- 开箱即用!使用Rancher 2.3 启用Istio初体验
- 服务网格数据平面的关键:层层剖析Envoy配置
- 入门了解Service Mesh + Istio?从本文开始
- Using Istio with Nginx ingress | giffgaff.io
- istio 可视化工具 kiali 部署体验 - 知乎
- Kiali: Service mesh observability and configuration
- Service Mesh Landscape | Layer5 - The Service Mesh Company
- 网络代理 Envoy 开源五周年,创始人 Matt Klein 亲述开源心路历程及经验教训 | 云原生社区
Config Map
介绍
Container技术(例如Docker)提供了三种简易方式来为运行在container中的应用提供configuration:
- 为container传递command-line arguments
- 为container设置不同的environment variables
- 将configuration file以Volume的形式挂在container上 Kubernetes也提供了两种Resources为container提供configuration:
- ConfigMap: 用于存储配置信息
- Secret: 用于存储敏感信息
为容器设置环境变量
设置configmap的所有Entry
spec:
  containers:
  - image: some-image
    envFrom:
    - prefix: CONFIG_
      configMapRef:
        name: my-config-map
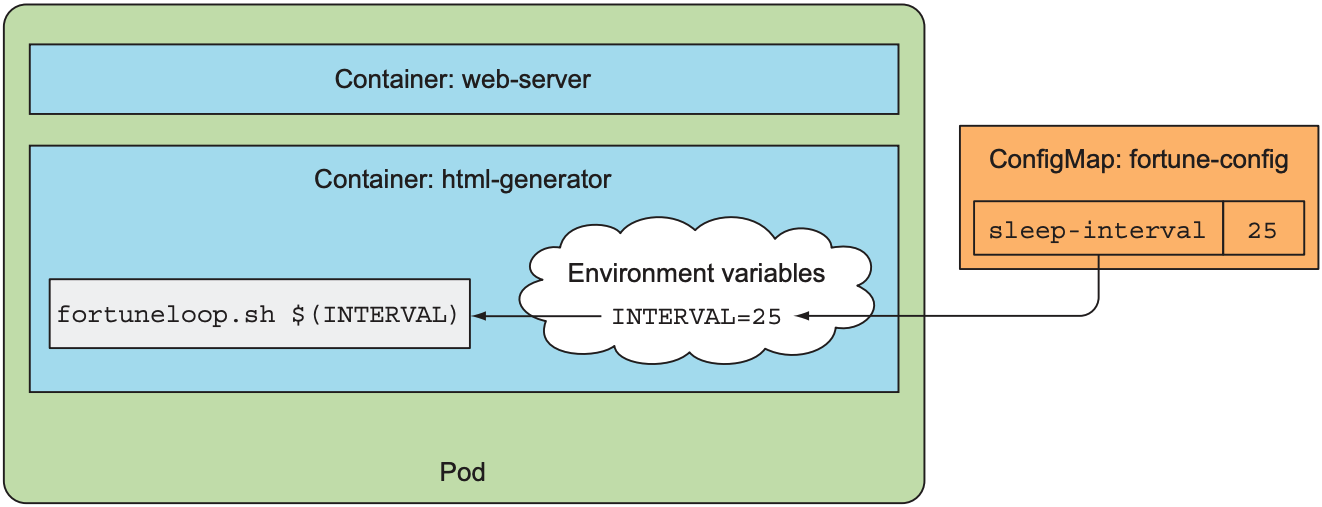
设置configmap中的一个Entry
apiVersion: v1
kind: Pod
metadata:
  name: fortune-args-from-configmap
spec:
  containers:
  - image: luksa/fortune:args
    env:
    - name: INTERVAL
      valueFrom:
        configMapKeyRef:
          name: fortune-config
          key: sleep-interval
    args: ["$(INTERVAL)"]
问题
- configmap的文件是只读,不可写和执行
- Deployment和Configmap是松耦合。程序不能很好的感知configmap的变化
- 没有版本管理
解决办法:gopaddle-io/configurator: Synchronize ConfigMaps & Secrets across Deployment Rollouts Strange things you never knew about Kubernetes ConfigMaps on day one – gopaddle blog
watcher
参考
- 两种方法,轻松上手ConfigMap!
- 从零开始入门 K8s:应用配置管理
- Strange things you never knew about Kubernetes ConfigMaps on day one – gopaddle blog
Operators
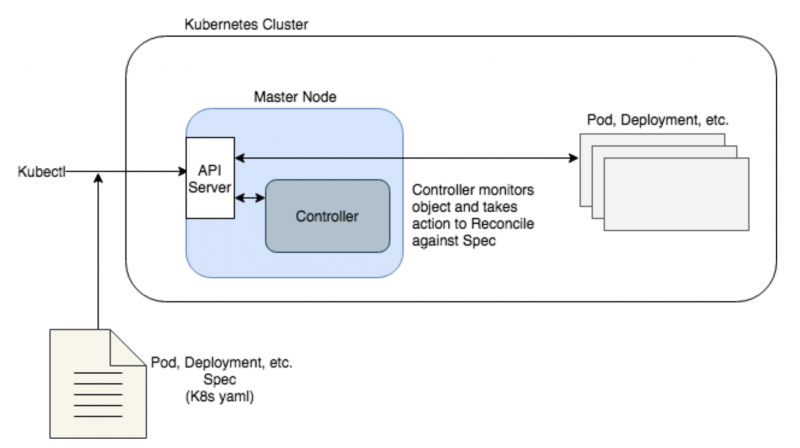
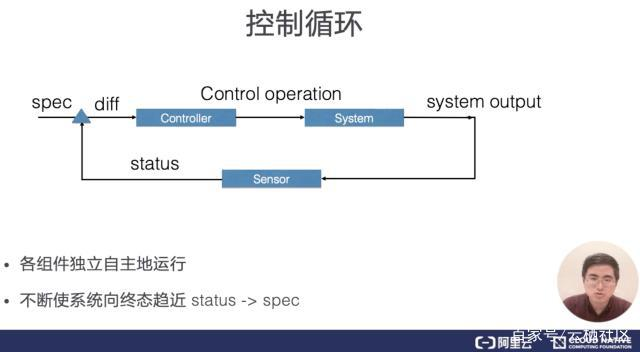
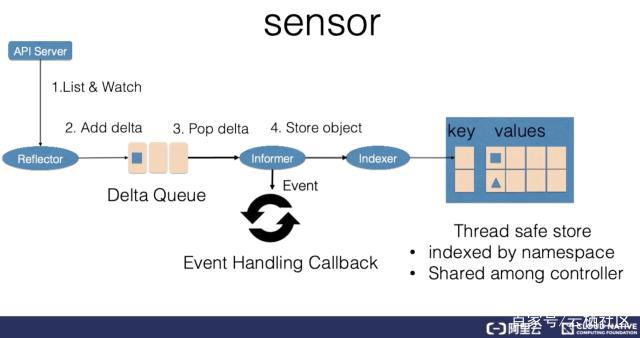
controller在 k8s中的作用
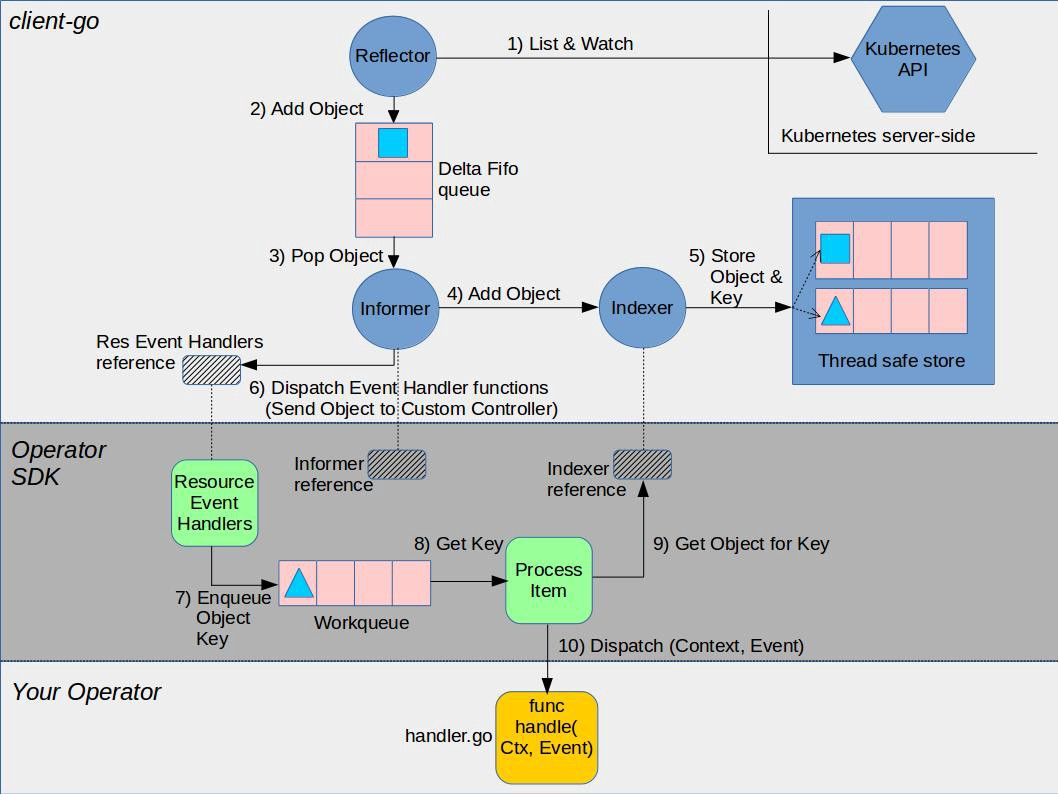
Operator框架
参考
- etcd-operator快速入门完全教程
- Kubernetes Operator
- Analyzing value of Operator Framework for Kubernetes community
- Introducing Operators: Putting Operational Knowledge into Software
- A Kubernetes Operator Tutorial? You got it, with the Operator-SDK and an Asterisk Operator!
HPA
介绍
 它根据Pod当前系统的负载来自动水平扩容,如果系统负载超过预定值,就开始增加Pod的个数,如果低于某个值,就自动减少Pod的个数。目前Kubernetes的HPA只能根据CPU等资源使用情况去度量系统的负载。HPA会根据监测到的CPU/内存利用率(资源指标),或基于第三方指标应用程序(如Prometheus等)提供的自定义指标,自动调整副本控制器、部署或者副本集合的pods数量(定义最小和最大pods数)。HPA是一种控制回路,它的周期由Kubernetes的controller manager 的--horizontal-pod-autoscaler-sync-period标志控制
操作
在一般情况下HPA是由kubectl来提供支持的。可以使用kubectl进行创建、管理和删除:
创建HPA
- 直接使用命令行创建
kubectl autoscale deployment hello-world –min=2 --man=5 –-cpu-percent=50
- 使用yaml 创建
apiVersion: autoscaling/v1
kind: HorizontalPodAutoscaler
metadata:
  name: lykops-hpa
  labels:
    software: apache
    project: lykops
    app: hpa
    version: v1
spec:
  scaleTargetRef:
    apiVersion: v1
    kind: Deployment
    name: lykops-hpa-deploy
    #这里只能为这三项
  minReplicas: 1
  maxReplicas: 10
  targetCPUUtilizationPercentage: 5
获取hpa信息
# 基本信息:
kubectl get hpa hello-worl
# 细节描述
kubectl describe hpa hello-world
删除hpa
kubectl delete hpa hello-world
参考
Prob 健康监测
pod的生命周期
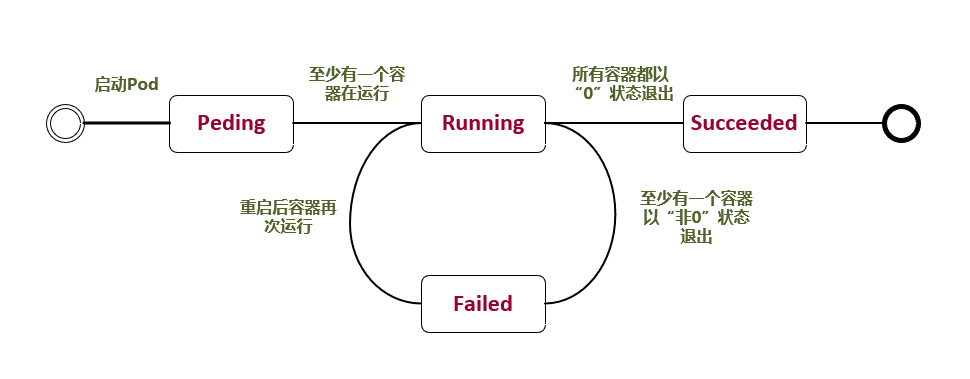
参考Pod Lifecycle官方文档,Pod的LifeCycle定义如下
| 状态 | 描述 |
|---|---|
| Pending | 正在创建 Pod,但是 Pod 中的容器还没有全部被创建完成,这其中也包含集群为容器创建网络,或者下载镜像的过程。 |
| Running | Pod 内所有的容器都已经被创建,且至少一个容器正在处于运行状态、正在启动状态或者重启状态。 |
| Succeeded | Pod 中所以容器都执行成功后退出,并且没有处于重启的容器。 |
| Failed | Pod 中所以容器都已退出,但是至少还有一个容器退出时为失败状态。 |
| Unknown | 由于一些原因,Pod 的状态无法获取,通常是与 Pod 通信时出错导致的。 |
pod 创建流程如下
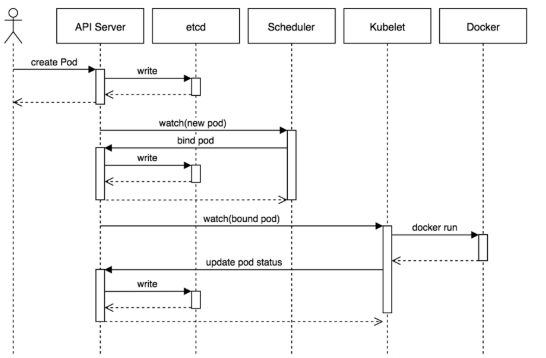 ① 用户通过kubectl客户端提交Pod Spec给API Server。
② API Server尝试将Pod对象的相关信息存储到etcd中,等待写入操作完成,API Server返回确认信息到客户端。
③ API Server开始反映etcd中的状态变化。
④ 所有的Kubernetes组件通过"watch"机制跟踪检查API Server上的相关信息变动。
⑤ kube-scheduler(调度器)通过其"watcher"检测到API Server创建了新的Pod对象但是没有绑定到任何工作节点。
⑥ kube-scheduler为Pod对象挑选一个工作节点并将结果信息更新到API Server。
⑦ 调度结果新消息由API Server更新到etcd,并且API Server也开始反馈该Pod对象的调度结果。
⑧ Pod被调度到目标工作节点上的kubelet尝试在当前节点上调用docker engine进行启动容器,并将容器的状态结果返回到API Server。
⑨ API Server将Pod信息存储到etcd系统中。
⑩ 在etcd确认写入操作完成,API Server将确认信息发送到相关的kubelet。
① 用户通过kubectl客户端提交Pod Spec给API Server。
② API Server尝试将Pod对象的相关信息存储到etcd中,等待写入操作完成,API Server返回确认信息到客户端。
③ API Server开始反映etcd中的状态变化。
④ 所有的Kubernetes组件通过"watch"机制跟踪检查API Server上的相关信息变动。
⑤ kube-scheduler(调度器)通过其"watcher"检测到API Server创建了新的Pod对象但是没有绑定到任何工作节点。
⑥ kube-scheduler为Pod对象挑选一个工作节点并将结果信息更新到API Server。
⑦ 调度结果新消息由API Server更新到etcd,并且API Server也开始反馈该Pod对象的调度结果。
⑧ Pod被调度到目标工作节点上的kubelet尝试在当前节点上调用docker engine进行启动容器,并将容器的状态结果返回到API Server。
⑨ API Server将Pod信息存储到etcd系统中。
⑩ 在etcd确认写入操作完成,API Server将确认信息发送到相关的kubelet。
Pod Conditions
每一个Pod都有一个PodStatus,是通过一个PodCondtions数组,来表示Pod的状态,每一个PodCondition有6个可能的字段
| 字段值 | 描述 |
|---|---|
| lastProbeTime | 表示这个condition上次探测的时间 |
| lastTransitionTime | 表示pod上一次状态变化的时间 |
| message | 描述pod状态转化的详情,人类可读的 |
| reason | 表示pod状态转化的唯一的、一个单词的、驼峰表示法的理由 |
| status | True, False, Unknown |
| type | PodScheduled: 这个pod已经被调度到一个node Ready:表示这个pod已经可以结束请求,可以被加入到服务的负载均衡列表里 Initialized: 所有的Init Containers已经启动成功了 ContainersReady: 所有的容器已经就绪 |
Pod重启策略
| 名称 | 描述 |
|---|---|
| Always | 只要容器失效退出就重新启动容器。 |
| OnFailure | 当容器以非正常退出后重新启动容器。 |
| Never | 无论容器状态如何,都不重新启动容器。 |
如果 restartpolicy 没有设置,那么默认值是 Always。RC 和 DaemonSet 必须指定重启策略为 Always。
Pod 常见状态转换场景
| Pod中的容器数 | Pod状态 | 发生事件 | Always | OnFailure | Never |
|---|---|---|---|---|---|
| 包含一个容器 | Running | 容器成功退出 | Running | Succeeded | Succeeded |
| 包含一个容器 | Running | 容器失败退出 | Running | Running | Failed |
| 包含两个容器 | Running | 1个容器失败退出 | Running | Running | Running |
| 包含两个容器 | Running | 容器内存溢出挂掉 | Running | Running | Failed |
Pod的Liveness和Readiness探针
探针介绍
kublet负责管理pod的生命周期,在创建Pod的时候负责初始化Init Containers,创建业务Containers,在主程序刚刚启动的时候可以指定一个post start 主程序启动开始后执行一些操作,在主程序结束前可以指定一个 pre stop 表示主程序结束前执行的一些操作。在pod创建完成后提供了两类定时探针Liveness P探针和Readiness 探针如下图
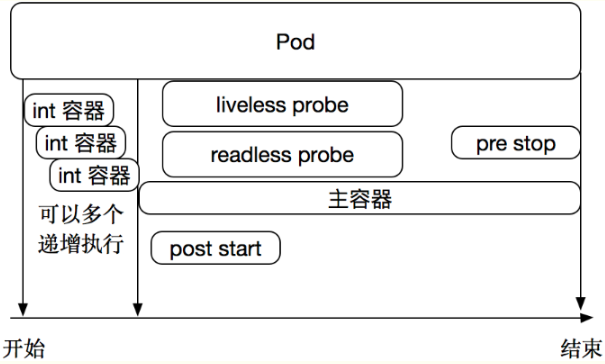 此外还有个特殊的 Startup 探针
Liveness 探针
- 用于判断容器是否存活(running状态)。
- 如果LivenessProbe探针探测到容器非健康,则kubelet将杀掉该容器,并根据容器的重启策略做相应处理。
- 如果容器不包含LivenessProbe探针,则kubelet认为该探针的返回值永远为“success”。
Liveness探针用来指示容器是否正在运行。如果存活探测失败,则 kubelet 会杀死容器,并且容器将受到其 重启策略 的影响。如果容器不提供存活探针,则默认状态为 Success。Kubelet使用liveness probe(存活探针)来确定何时重启容器。例如,当应用程序处于运行状态但无法做进一步操作,liveness探针将捕获到deadlock,重启处于该状态下的容器,使应用程序在存在bug的情况下依然能够继续运行下去。
Readiness 探针
- 用于判断容器是否启动完成(read状态),可以接受请求。
- 如果Readness探针检测失败,则Pod的状态将被修改。Endpoint Controller将从Service的Endpoint中删除包含该容器所在Pod的Endpoint。
Readiness探针指示容器是否准备好服务请求。如果就绪探测失败,端点控制器将从与 Pod 匹配的所有 Service 的端点中删除该 Pod 的 IP 地址。初始延迟之前的就绪状态默认为 Failure。如果容器不提供就绪探针,则默认状态为 Success。Kubelet使用readiness probe(就绪探针)来确定容器是否已经就绪可以接受流量。只有当Pod中的容器都处于就绪状态时kubelet才会认定该Pod处于就绪状态。该信号的作用是控制哪些Pod应该作为service的后端。如果Pod处于非就绪状态,那么它们将会被从service的load balancer中移除。
Startup 探针
Startup探针用来显示应用是否已经启动。如果Startup 探针提供了,那么其他的探针在startup成功之前,是被禁止的,如果Startup探针失败,kubelet会kill掉Pod,然后具体操作,参考Pod的 重启策略,如果容器不提供Startup探针,那么默认认为是Success
Pod探针的探测方式和结果
探针支持以下集中探测方式
| 动作 | 描述 |
|---|---|
| ExecAction | 在容器中执行指定的命令,如果执行成功,退出码为 0 则探测成功。 |
| HTTPGetAction | 通过容器的IP地址、端口号及路径调用 HTTP Get方法,如果响应的状态码大于等于200且小于400,则认为容器 健康。 |
| TCPSocketAction | 通过容器的 IP 地址和端口号执行 TCP 检 查,如果能够建立 TCP 连接,则表明容器健康。 |
对应的探测结果有三种
| 状态 | 描述 |
|---|---|
| 成功 | 容器通过了诊断。 |
| 失败 | 容器未通过诊断。 |
| 未知 | 诊断失败,因此不会采取任何行动。 |
liveness探针使用示例
- 使用exec方式
apiVersion: v1
kind: Pod
metadata:
  name: liveness-exec
  labels:
    app: liveness
spec:
  containers:
  - name: liveness
    image: busybox
    args:                       #创建测试探针探测的文件
    - /bin/sh
    - -c
    - touch /tmp/healthy; sleep 30; rm -rf /tmp/healthy; sleep 600
    livenessProbe:
      initialDelaySeconds: 10   #延迟检测时间
      periodSeconds: 5          #检测时间间隔
      exec:
        command:
        - cat
        - /tmp/healthy
- http get例子
apiVersion: v1
kind: Pod
metadata:
  labels:
    test: liveness
  name: liveness-http
spec:
  containers:
  - args:
    - /server
    image: k8s.gcr.io/liveness
    livenessProbe:
      httpGet:
        # when "host" is not defined, "PodIP" will be used
        # host: my-host
        # when "scheme" is not defined, "HTTP" scheme will be used. Only "HTTP" and "HTTPS" are allowed
        # scheme: HTTPS
        path: /healthz
        port: 8080
        httpHeaders:
        - name: X-Custom-Header
          value: Awesome
      initialDelaySeconds: 15
      timeoutSeconds: 1
    name: liveness
- tcp例子
apiVersion: v1
kind: Pod
metadata:
  name: liveness-tcp
  labels:
    app: liveness
spec:
  containers:
  - name: liveness
    image: nginx
    livenessProbe:
      initialDelaySeconds: 15
      periodSeconds: 20
      tcpSocket:
        port: 80
readiness 探针使用例子
基本和liveness探针使用一样,这里不再详述
apiVersion: v1
kind: Pod
metadata:
  name: springboot
  labels:
    app: springboot
spec:
  containers:
  - name: springboot
    image: mydlqclub/springboot-helloworld:0.0.1
    ports:
    - name: server
      containerPort: 8080
    - name: management
      containerPort: 8081
    readinessProbe:
      initialDelaySeconds: 20
      periodSeconds: 5
      timeoutSeconds: 10
      httpGet:
        scheme: HTTP
        port: 8081
        path: /actuator/health
参考
- Kubernetes Pod 健康检查机制
- K8S钩子操作
- Kubernetes中Pod的健康检查
- Multi-Container Pod Design Patterns - CKAD Course
- You (probably) need liveness and readiness probes | by Benjamin Porter | ITNEXT
- Kubernetes Readiness Probes — Examples & Common Pitfalls | by Loft | ITNEXT
- Using Finalizers to Control Deletion | Kubernetes
K8s 日志收集
社区的日志通用收集框架
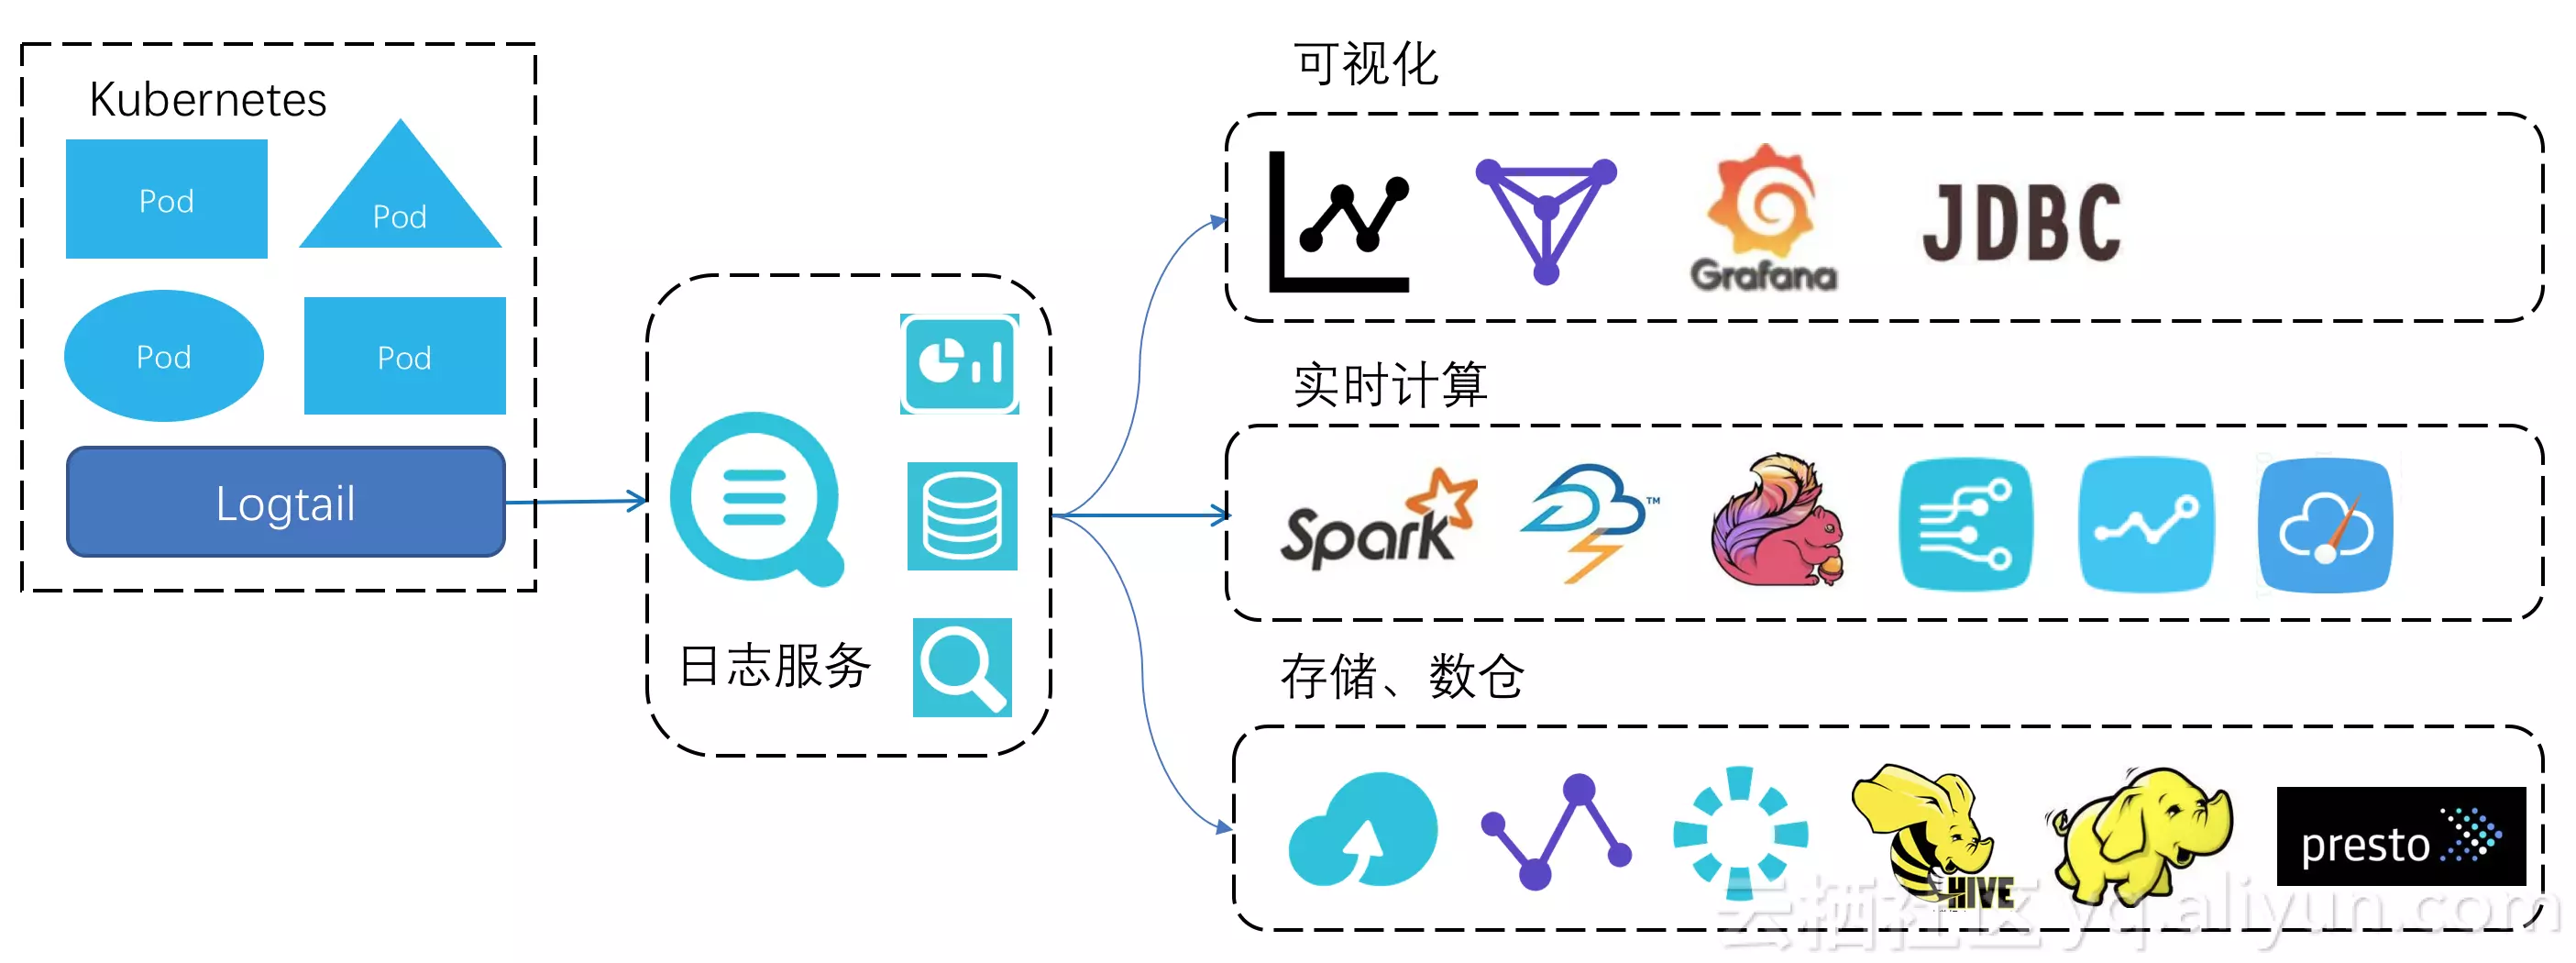
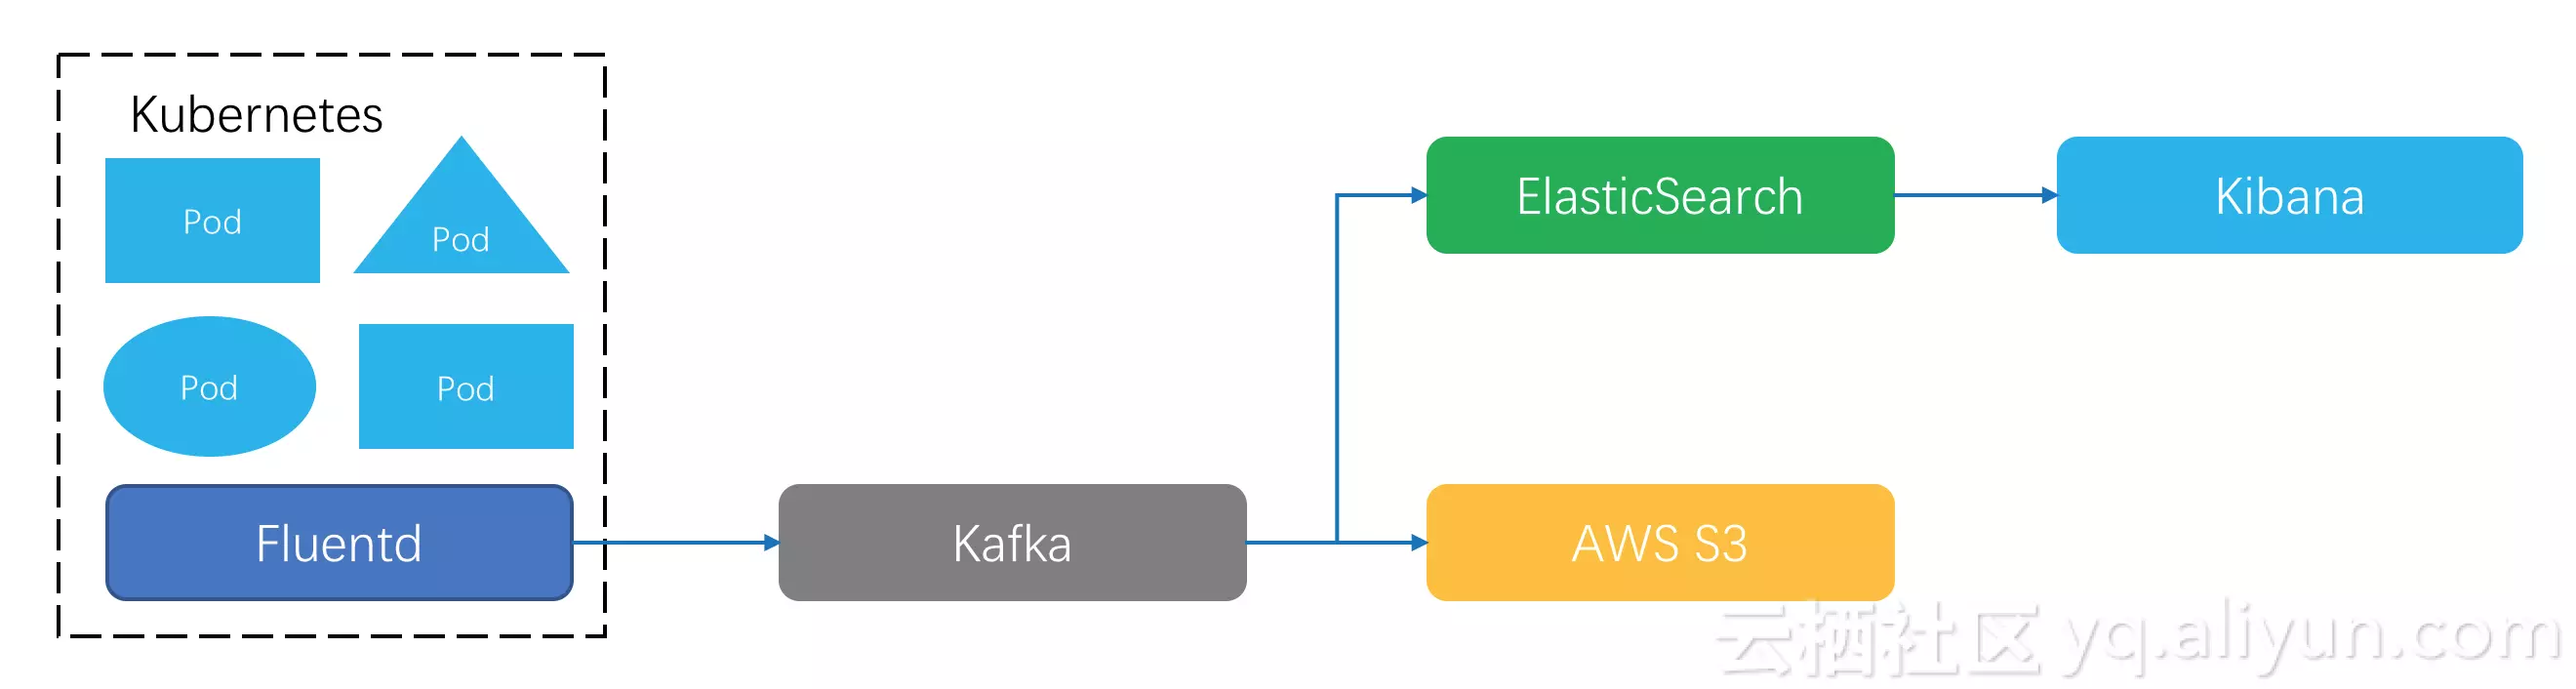 日志客户端把数据格式化好之后用指定协议上传到存储端,常见的选择有Kafka。Kafka支持实时订阅、重复消费,后期可以再根据业务需要把数据同步到其它系统去,比如:业务日志到Elastic Search做关键词查询,结合Kibana做日志可视化分析;金融场景日志要长期留存,可以选择投递Kafka数据到AWS S3这样的高性价比存储上。
这个架构看起来简洁有效,但在Kubernetes下距离完美还有些细节问题要解决:
首先,这是一个标准的节点级采集方案,Kubernetes下fluentd等客户端的程序部署、采集配置管理是个难题,在日志采集路由、数据打标、客户端配置等问题没有针对性优化。 其次,在日志的消费上,虽然Kafka的软件生态足够丰富,但是仍然需要专业人员来维护,要做业务规划、考虑机器水位、处理硬件损坏。如果要查询分析日志,还需要有对Elastic Search系统有足够了解。我们知道在PB级数据场景下,分布式系统的性能、运维问题开始凸显,而驾驭这些开源系统需要很强的专业能力。
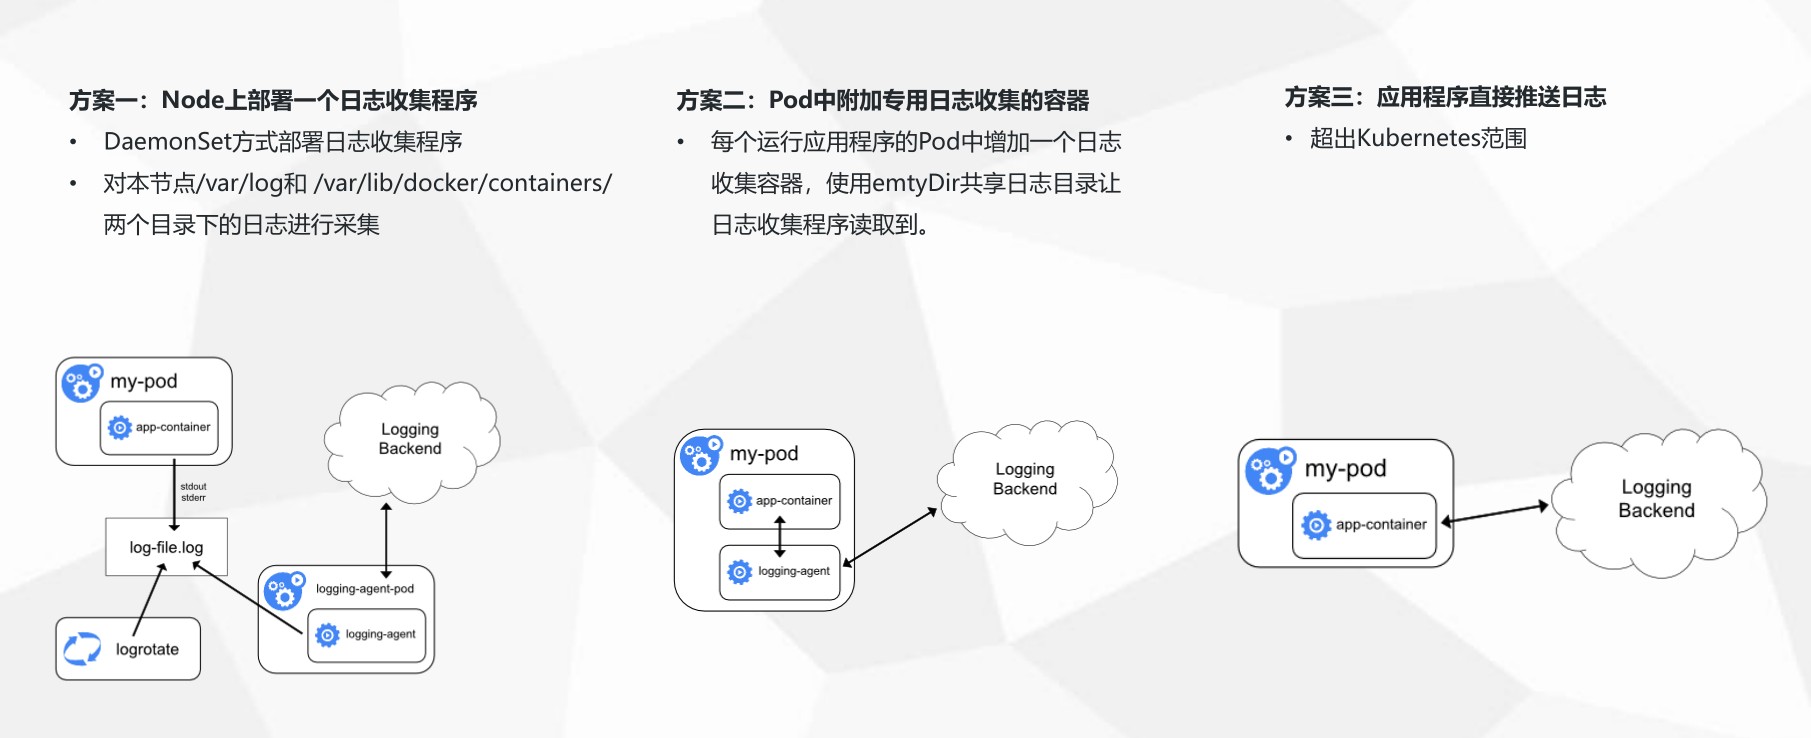
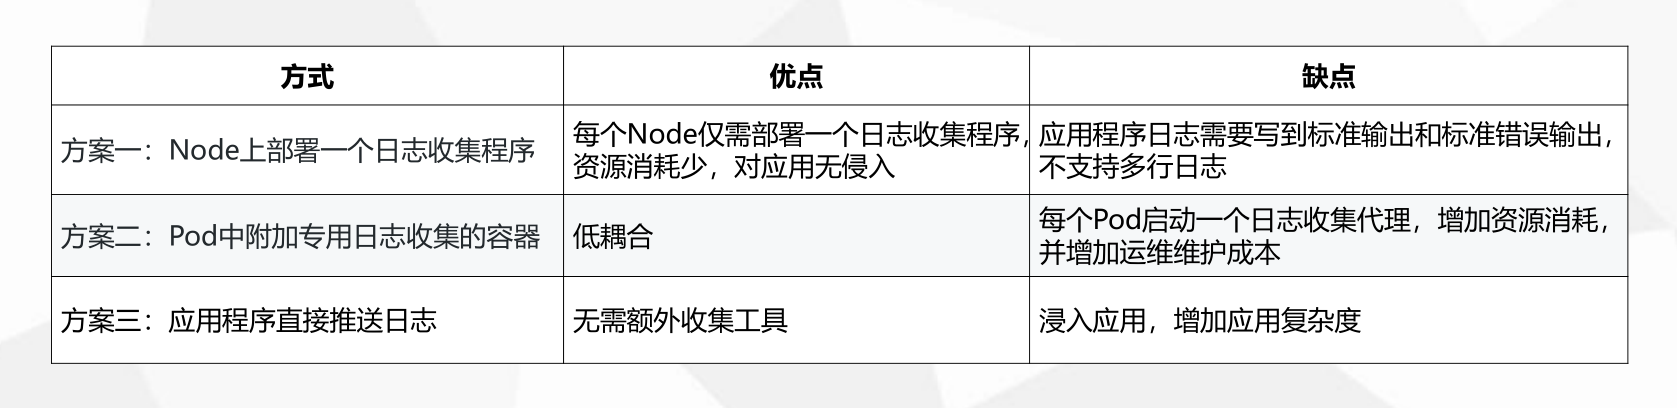
公司一般常用的日志架构
参考
- k8s日志收集方案
- 从零开始入门 K8s:监控与日志的可观测性
- 如何对docker container 的日志 做 logrotate
- logrotate 日志接个
- LC3视角:Kubernetes下日志采集、存储与处理技术实践
Kubernetes DNS
参考
Kubernetes 标签
介绍
Label是Kubernetes系统中的一个核心概念。Label以key/value键值对的形式附加到任何对象上,如Pod,Service,Node,RC(ReplicationController)/RS(ReplicaSet)等。Label可以在创建对象时就附加到对象上,也可以在对象创建后通过API进行额外添加或修改。
设计初衷
Labels enable users to map their own organizational structures onto system objects in a loosely coupled fashion, without requiring clients to store these mappings.
label的操作
新增
- 通过metadata.labels来定义
apiVersion: v1
kind: Pod
metadata:
  name: nginx
  labels:
    app: nginx
    release: stable
spec:
  containers:
  - name: nginx
    image: nginx
    ports:
    - containerPort: 80
上面的描述文件为名为nginx的Pod添加了两个Label,分别为app: nginx和release: stable。
- 通过kubectl 命令行
  kubectl run hazelcast --image=hazelcast --labels="app=hazelcast,env=prod"

  kubectl label pods foo unhealthy=true
更新
kubectl label --overwrite pods foo status=unhealthy [al=true]
查看
kubectl get pods --show-labels
过滤 Selector
- = 和 !=
kubectl get -lapp.bjca.footstone/status=online
- in 和 not in
[root@fs02-192-168-126-16 ~]# kubectl get -lapp.bjca.footstone/status in(online)
参考
- Kubernetes基本概念之Label
- kubernets过滤pod标签(labels)
- label和selector
- 容器编排技术 -- Kubernetes kubectl label 命令详解
K8s元数据
1. kubernetes 资源对象
2. labels
3. selector
4. anotations
5. OwnerRefernce
参考
kubernetes etcd
参考
k8s概念详解
参考
- 从零开始入门 K8s | k8s概念详解
- 从零开始入门 K8s | 深入剖析 Linux 容器
- 从零开始入门 K8s:应用编排与管理
- 从零开始入门 K8s:应用编排与管理:Job & DaemonSet
- Kubernetes概念与术语
k8s Pod
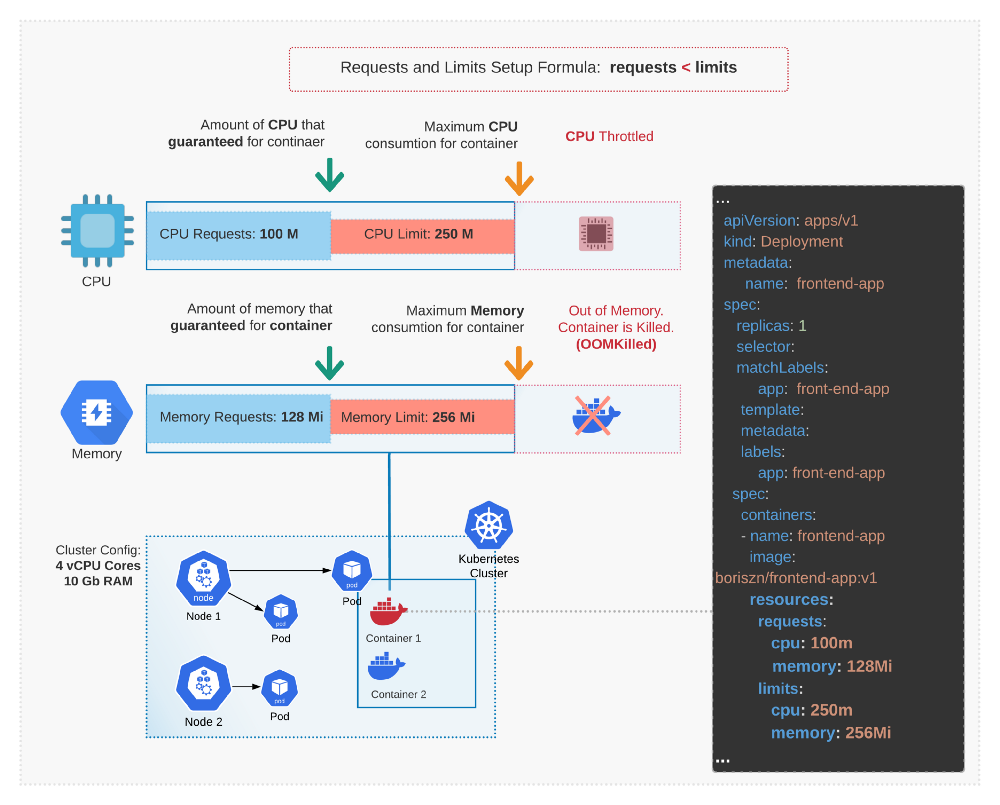
pod 限制
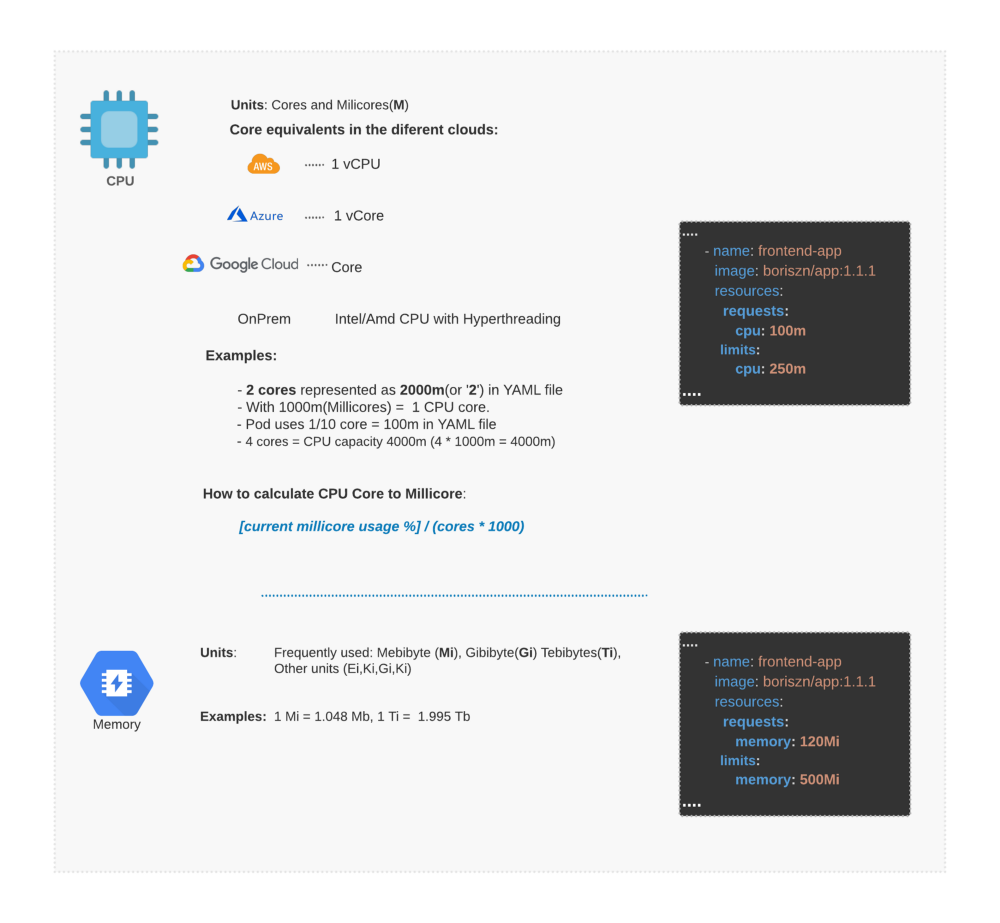
 单位
单位
 总数配额
总数配额
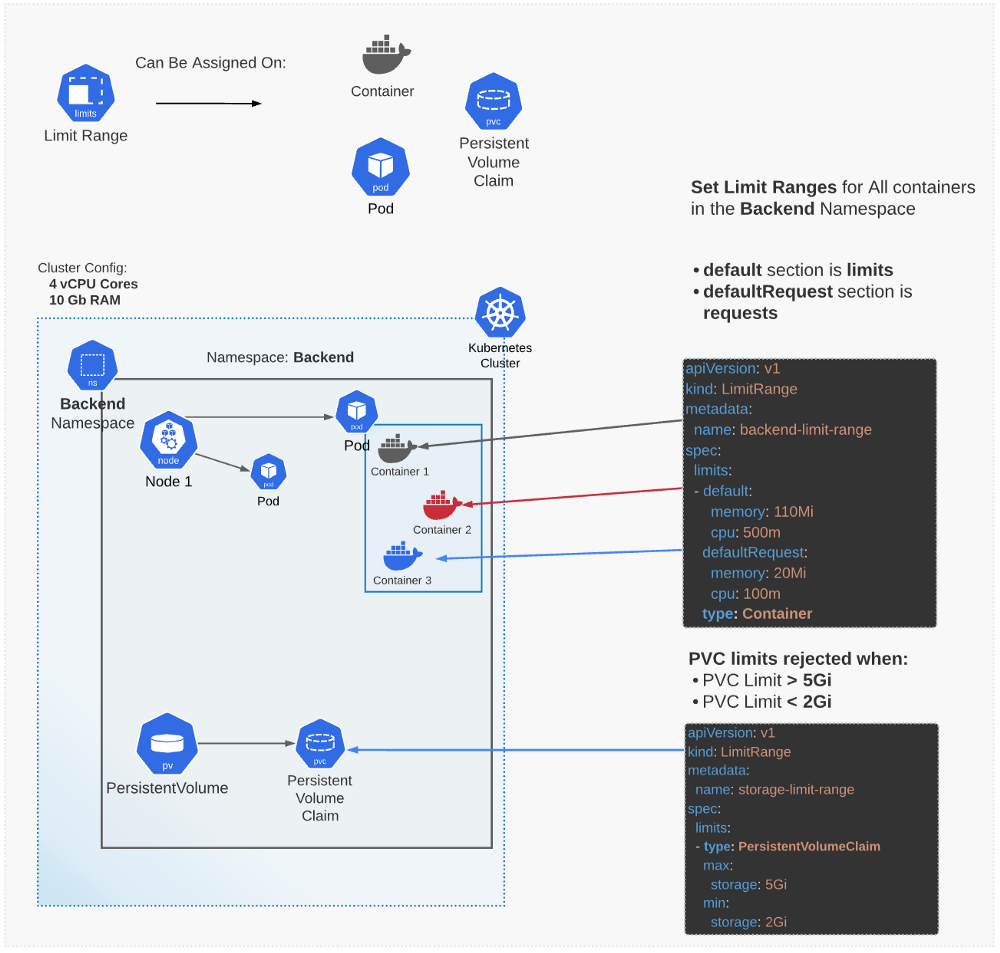
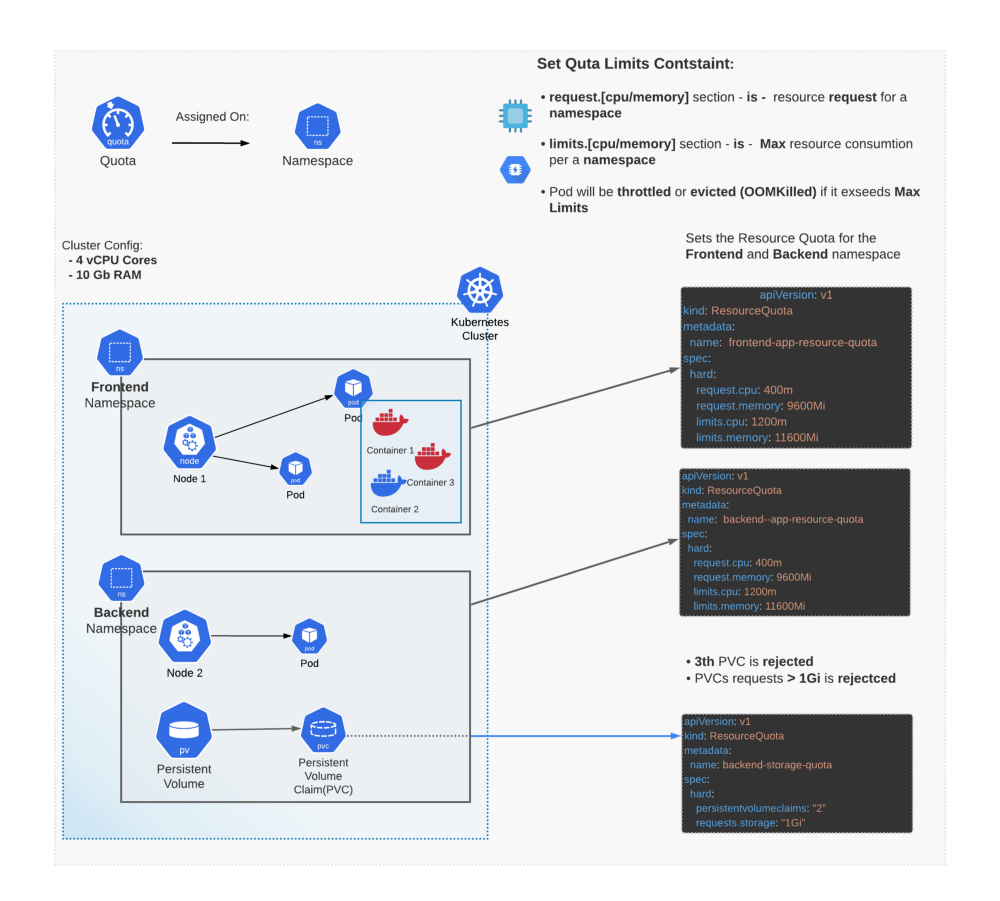 限制
限制
pod的扩展
1.Pod Preset Kubernetes为Preset提供了一个允许控制器(admission controller),当创建创建pod的请求到达时,通过这个允入控制器将label selector选中的Preset应用到pod中,具体流程如下:
1. 检索系统中所有可用的Presets。
2. 检查所有Preset的label selector是否与当前pod的标签匹配。
3. 尝试将匹配Preset中的各种资源合并进正在创建的pod。
4.如果发生错误,为pod抛出合并Preset失败的异常事件,然后在不合并Preset所提供资源的情况下创建pod(合并失败并没有阻挡pod的创建)。
5. 如果合并成功,向合并后的结果spec加入到pod的注解中,表示pod被Preset修改了,注册格式如下:
podpreset.admission.kubernetes.io/podpreset-
pod对环境的感知
kubernetes 自从1.7开始,可以在pod 的container 内获取pod的spec,metadata 等信息。
      env:
        - name: MY_NODE_NAME
          valueFrom:
            fieldRef:
              fieldPath: spec.nodeName
        - name: MY_POD_NAME
          valueFrom:
            fieldRef:
              fieldPath: metadata.name
        - name: MY_POD_NAMESPACE
          valueFrom:
            fieldRef:
              fieldPath: metadata.namespace
        - name: MY_POD_IP
          valueFrom:
            fieldRef:
              fieldPath: status.podIP
        - name: MY_POD_SERVICE_ACCOUNT
          valueFrom:
            fieldRef:
              fieldPath: spec.serviceAccountName
pod内部container共享
- 共享卷
参考
- 从零开始入门 K8s:详解 Pod 及容器设计模式 2.jessfraz title: Injecting Information into Pods Using a PodPreset
- kubernetes 容器内获取Pod信息(包括:宿主主机IP)
- Expose Pod Information to Containers Through Environment Variables
- how can get the hostIP in a pod
- Multi-container pods and container communication in Kubernetes
- Easy and Fast Adjustment of Kubernetes CPU and Memory | by Boris Zaikin | ITNEXT
资源限制
Java 低版本对容器缺乏支持
java 从jdk1.8-u131版本开始增加对docker环境变量的支持
java -XX:+UnlockExperimentalVMOptions -XX:+UseCGroupMemoryLimitForHeap
低版本不能感知docker对资源的隔离,即是是jdk1.8-u131以上,在容器内部du8i宿主机上的/proc,对meminfo, cpuinfo,stat, uptime等感知也是不完善的。 所以一种更优的方案出来了。就是lxcfs
lxcfs
what's lxcfs?
lxcfs 是一个开源的FUSE(用户态文件系统)实现来支持LXC容器,它也可以支持Docker容器。
how lxfcs work
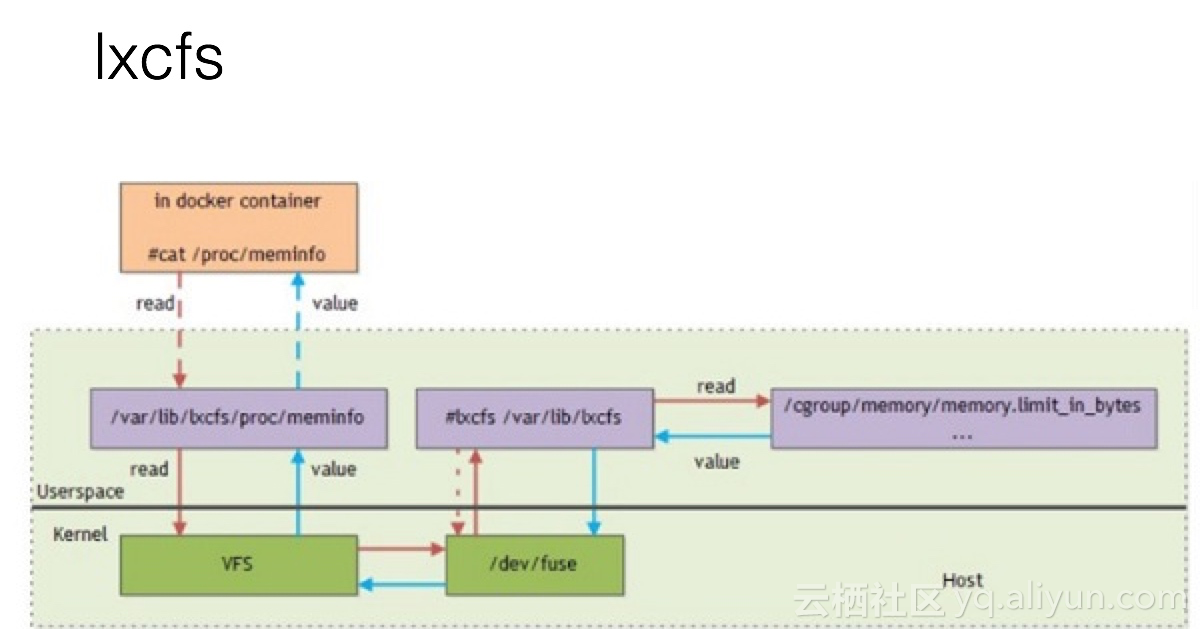 比如,把宿主机的 /var/lib/lxcfs/proc/memoinfo 文件挂载到Docker容器的/proc/meminfo位置后。容器中进程读取相应文件内容时,LXCFS的FUSE实现会从容器对应的Cgroup中读取正确的内存限制。从而使得应用获得正确的资源约束设定。
参考
- Kubernetes之路 2 - 利用LXCFS提升容器资源可见性
- Java SE support for Docker CPU and memory limits
- Kubernetes之路 1 - Java应用资源限制的迷思
- Kubernetes之路 3 - 解决服务依赖
- linux fusion file system
- 聊聊新版JDK对docker容器的支持
- Pod Lifecycle Event Generator: Understanding the “PLEG is not healthy” issue in Kubernetes
运维
Evicted Pod 太多
Evicted Pod 产生的原因
The kubelet can proactively monitor for and prevent total starvation of a compute resource. In those cases, the kubelet can reclaim the starved resource by proactively failing one or more Pods. When the kubelet fails a Pod, it terminates all of its containers and transitions its PodPhase to Failed. If the evicted Pod is managed by a Deployment, the Deployment will create another Pod to be scheduled by Kubernetes.
简单来讲: 资源不足,kubelet会停止pod, 但是 replicaset会自动复制pod
Also ask yourself why are there so many evicted pods? Maybe your kube-scheduler keeps scheduling pods on a node which already reports DiskPressure or MemoryPressure? This could be the case if the kube-scheduler is configured with a custom --policy-config-file which has no CheckNodeMemoryPressure or CheckNodeDiskPressure in the list of policy predicates.
处理方案
- 调度的时候应该考虑内存的预留问题 需要调整 kube-scheduler 增加自定义 --policy-config-file 去配置CheckNodeMemoryPressure和CheckNodeDiskPressure
- 可以通过kube-controller-manager实现回收evicted pods 更新 kube-controller-manager set --terminated-pod-gc-threshold 100或者更少, 默认是12500 太大。
- 可以写个定时任务,定期执行清楚evicted pods
如何删除Evicted Pod
kubectl get pods -n $namespace|grep "Evicted"|awk '{print $1}'|sed 's/^/kubectl delete -n cattle-system pod /'|sh
Pod 阻塞在Terminating状态
参考
问题
- k8s 重启策略设置为always的时候,如何设置最大的重试次数 目前1.13 kubectl并没有暴露接口, 变相的措施,增加监控报警,自动控制回收策略
K8S Node
概念
Node的是什么?
Node 是 Kubernetes 的工作节点,以前叫做 minion。取决于你的集群,Node 可以是一个虚拟机或者物理机器。每个 node 都有用于运行 pods 的必要服务,并由 master 组件管理。Node 上的服务包括 Docker、网络组件 (flannel)、kubelet 和 kube-proxy。
Node状态
Node的状态是通过Node Conditions字段描述的
| Node 条件 | 描述 |
|---|---|
| Ready | True 节点运行状况良好并准备好接受Pod,False 如果节点运行状况不佳并且未接受Pod,Unknown 节点控制器最近一次未从节点收到消息 node-monitor-grace-period(默认值为40秒) |
| MemoryPressure | True 节点内存上存在压力,即节点内存不足;除此以外 False |
| PIDPressure | True 进程是否存在压力,即节点上的进程是否过多;除此以外 False |
| DiskPressure | True 磁盘大小是否受到压力,即磁盘容量是否不足;除此以外 False |
| NetworkUnavailable | True 节点的网络配置不正确,否则 False |
资源超卖
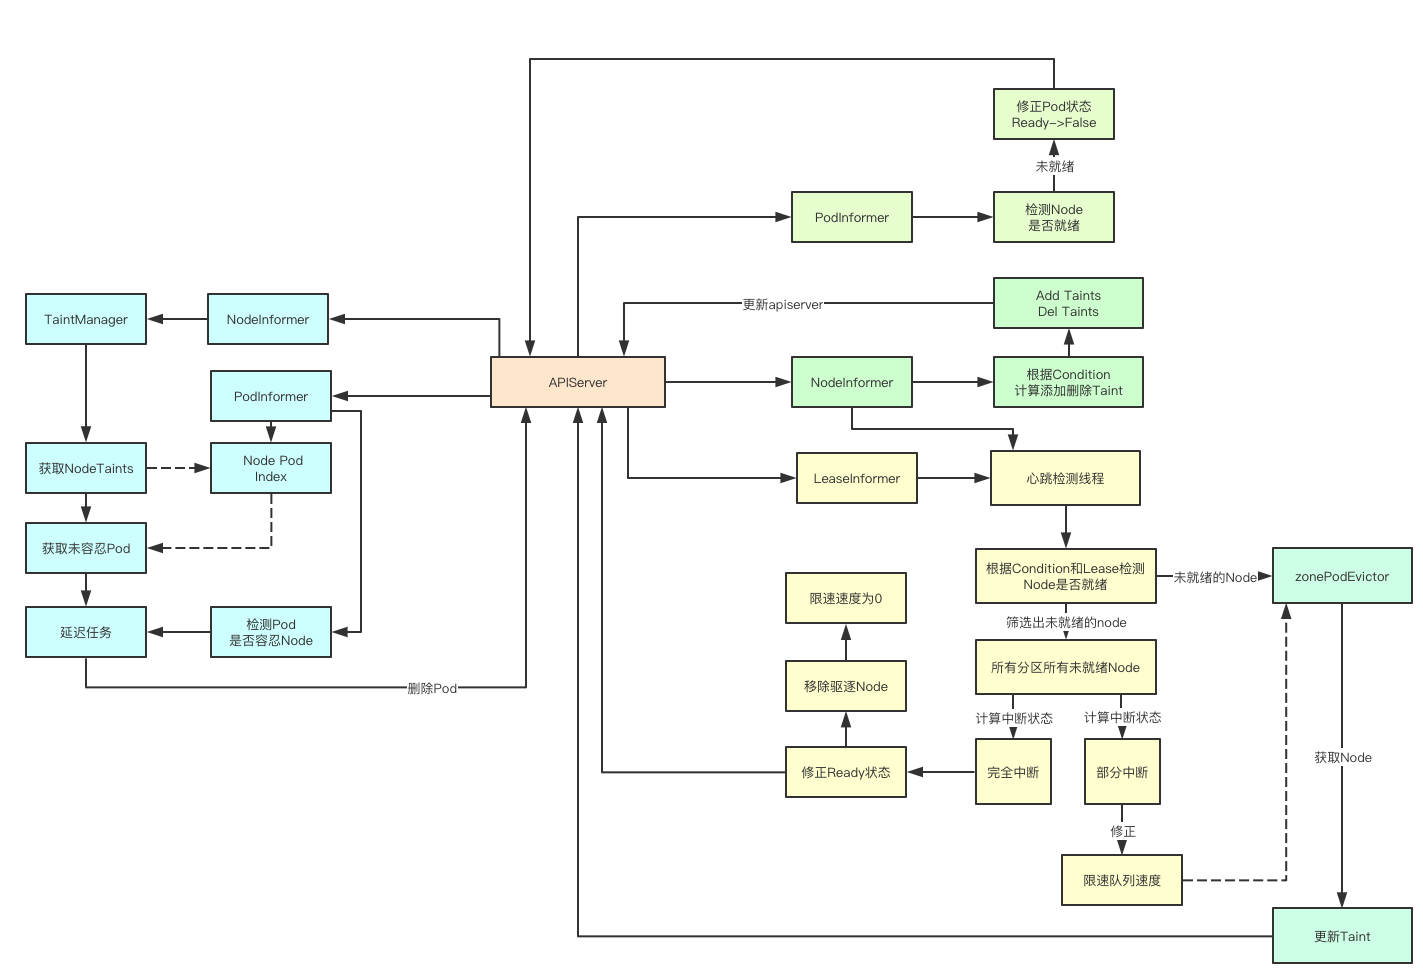
Node 故障处理过程
下图更好的说明了Node的故障处理过程
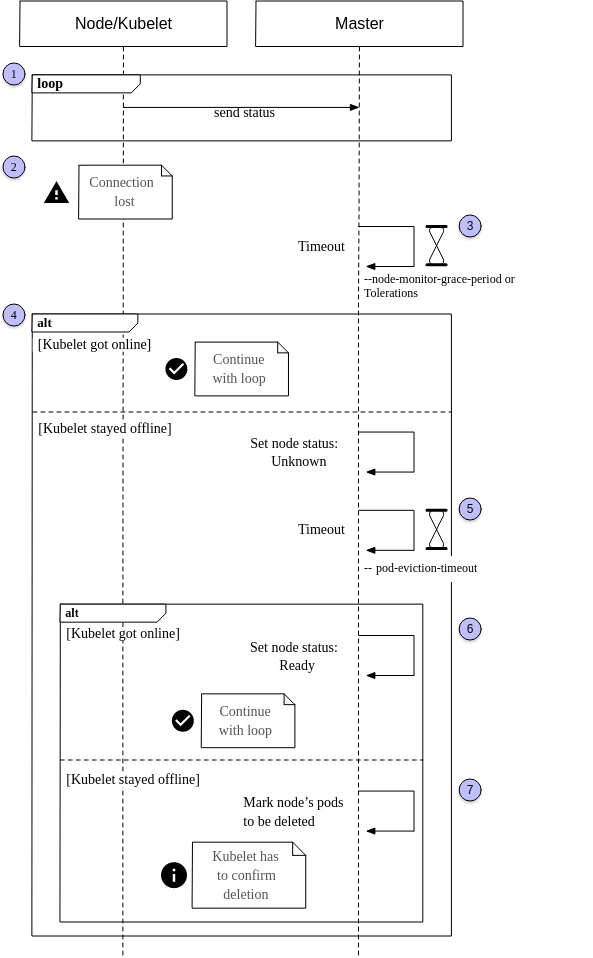
- 在一个健康的系统中,节点上运行的 kubelet 不断地向主节点(1)报告它的状态。这是通过设置 kubelet 的 CLI 参数
--node-status-update-frequency来控制的,它的默认值是10。这样,主服务器就可以随时了解集群节点的健康状况,并以正确的方式调度 pods。 - 当kubelet 失去了与master的联系,比如:节点可能已经崩溃或网络有故障。很显然,master是不可能被通知到node有故障了 ,k8s是通过检查node的超时时间
--node-monitor-grace-period(默认值在the controller manager设置,默认值为40s),换句话说,kubelet 可以有40s的时间恢复,并将其状态发送给主节点,直到进入步骤4(实际中,从unready->unhealth,还需要考虑node-startup-grace-period参数,当node失联后一段时间后,kubernetes判定node为unhealthy,这段时长的配置项为 node-startup-grace-period ,默认1m0s) - 如果在规定的时间内,master再次收到了kubelet,那么表示master正常了,继续循环,如果节点无法在给定的超时中响应,则将其状态设置为 Unknown,并启动第二个超时(5),这个超时,叫做
--pod-eviction-timeout, 用来控制什么时间这台node上的pod什么时候被清理(默认值是5分钟),如果在这个时间内,node恢复正常,master会将node标识会ready。 那么流程又恢复到刚开始的循环中 - 当在
--pod-eviction-timeout内,node仍然没有相应,那么这台机器上的pod就会标识为delete。 需要注意的是,这些pods并不是马上被删除,而是需要等到node恢复连接到master的时候来确认这次 删除。 如果确认删除不可能, 比如,这台机器永久的挂了, 那么我们必须手动删除这些pods。
更详细的实现如下图
Taints and Tolerations
即使您将收回超时设置为一个较低的值 -- pod-eviction-timeout,您也可能会注意到需要5分钟才能删除 pods。这是因为管理Controller为每个 pod 设置了默认的toleration,允许它在一段时间内停留在not-ready或unreachable的节点上。
tolerations:
- key: node.kubernetes.io/not-ready
  effect: NoExecute
  tolerationSeconds: 300
- key: node.kubernetes.io/unreachable
  operator: Exists
  effect: NoExecute
  tolerationSeconds: 30
正如您在上面的默认配置中看到的,该值被设置为300秒/5分钟。一个可能的解决方案是对每个 pod 应用一个自定义配置,其中这个值根据您的需要进行调整。您还可以全局调整此设置。
举例: 当选择一个20秒的值(忍受时间秒)时,删除一个 pod 总共需要60秒,因为 -- node-monitor-grace-period 值在此之前已经被考虑在内。
参考
- Blog: How Kubernetes handles offline nodes
- 图解kubernetes控制器Node生命周期管理
- K8S node NotReady 后如何保证服务可用
- kubernetes node节点失效 调度
- 记一次 k8s 集群单点故障引发的血案
- Kubernetes recreate pod if node becomes offline timeout
- kube-controller-manager
- Nodes
- Kubernetes节点资源耗尽状态的处理
- Kubernetes节点资源耗尽状态的处理
Kubernetes Schedule
原理
问题
k8s是通过sceduler来调度pod的,在调度过程中,由于一些原因,会出现调度不均衡的问题,例如:
节点故障 新节点被加到集群中 节点资源利用不足 这些都会导致pod在调度过程中分配不均,例如会造成节点负载过高,引发pod触发OOM等操作造成服务不可用
其中,节点资源利用不足时是最容易出现问题的,例如,设置的requests和limits不合理,或者没有设置requests/limits都会造成调度不均衡
分析
在这之前,我们需要先装一个metrics,安装方法可参考:k8s的metrics部署
Scheduler在调度过程中,经过了预选阶段和优选阶段,选出一个可用的node节点,来把pod调度到该节点上。那么在预选阶段和优选阶段是如何选出node节点的呢?
最根本的一个调度策略就是判断节点是否有可分配的资源,我们可以通过以下·kubectl describe node node名来`查看,现在按照这个调度策略来分析下
查看当前的节点资源占用情况
可以看到,当前的k8s集群共有三个node节点,但是节点的资源分布情况极其不均匀,而实际上,k8s在进行调度时,计算的就是requests的值,不管你limits设置多少,k8s都不关心。所以当这个值没有达到资源瓶颈时,理论上,该节点就会一直有pod调度上去。所以这个时候就会出现调度不均衡的问题。有什么解决办法?
- 给每一个pod设置requests和limits,如果资源充足,最好将requests和limits设置成一样的,提高Pod的QoS
- 重平衡,采取人为介入或定时任务方式,根据多维度去对当前pod分布做重平衡
解决方案
参考
- k8s解决pod调度不均衡的问题 - 云+社区 - 腾讯云
- Advanced Kubernetes pod to node scheduling | Cloud Native Computing Foundation
K8S Terminal
What is k8s-web-terminal?
If you are using docker or kubernetes for your service, you will need to login the container and execute some commands.
You have some ways to achieve this.
-
login by
docker exec
Annoying, because you have to find the node, login to the node, find the container ... -
login by management tool like Rancher
Enjoyable but not Flexible, because you can not develop by your own requirement. - login by implement your own tool
K8S Terminal 工作原理
a k8s web terminal usually builds websocket connection between docker REST API and frontend js.
Input from frontend will be sent to docker container if there is any, and output from container will be sent to frontend if there is any.
The frontend use xterm.js plugin to render the terminal.
参考代码
- c9s/kubernetes-term: Connecting xterm.js to kubernetes exec spdy stream with socket.io
- zhanghaohao/k8s-web-terminal: web terminal for docker container
- va1da5/xtermjs-for-k8s-pods: PoC for communicating with Kubernetes websocket for executing shell commands in pods
k8s的ETCD
- Etcd Performance Consideration. The Etcd is the heart of the… | by Zhimin Wen | ITNEXT
- How etcd works and 6 tips to keep in mind | Pixie Labs Blog
- Onwards to the Core: etcd |
- How etcd works with and without Kubernetes
监控
- Setting up Distributed Tracing in Kubernetes with OpenTracing, Jaeger, and Ingress-NGINX | by Fernando Diaz | Apr, 2021 | Medium
- bcicen/ctop: Top-like interface for container metrics
- How we use metamonitoring Prometheus servers to monitor all other Prometheus servers at Grafana Labs | Grafana Labs
- yashvardhan-kukreja/kube-bench-exporter: Helps you to export your kube-bench reports to multiple targets like Amazon S3 buckets with ease.
Network Policy
图形化学习
- Network Policy Editor for Kubernetes
- NetworkPolicy Editor: Create, Visualize, and Share Kubernetes NetworkPolicies — Cilium
http 访问kubelet api
kubectl 插件
- Lifting Developers’ Productivity with BuildKit CLI for kubectl - Container Registry
- rewanthtammana/kubectl-fields: Kubectl resources hierarchy parsing tool
- replicatedhq/outdated: Kubectl plugin to find and report outdated images running in a Kubernetes cluster
- Learnk8s (@learnk8s) / Twitter
- ishantanu/awesome-kubectl-plugins: Curated list of kubectl plugins
- rewanthtammana/kubectl-fields: Kubectl resources hierarchy parsing tool
- predatorray/kubectl-tmux-exec: A kubectl plugin to control multiple pods simultaneously using Tmux
-
corneliusweig/ketall: Like
kubectl get all, but get really all resources
Dashboard
- skooner-k8s/skooner: Simple Kubernetes realtime dashboard and management
- astefanutti/kubebox: ⎈❏ Terminal and Web console for Kubernetes
- deckhouse/deckhouse: Kubernetes platform from Flant
镜像管理
镜像缩减
- 选择较小的基础镜像
- 减少镜像的封层
- 应用软件减小
- 依赖减小
pull through
失败镜像处理
- FairwindsOps/saffire: Controller to override image sources in the event that an image cannot be pulled.
- Tolerating failures in container image registries - Kintone Engineering Blog
镜像缓存管理
OCI镜像拉取
gitops
运维
安装
1. 成本
- How To Run The Cheapest Kubernetes Cluster at $1 Per Day | by George Paw | Medium
- aporia-ai/kubesurvival: 💰 Significantly reduce Kubernetes costs by finding the cheapest machine types that can run your workloads
- Kubernetes instance calculator
2. 安全
负载均衡
监控
- kubesphere/kubeeye: KubeEye aims to find various problems on Kubernetes, such as application misconfiguration, unhealthy cluster components and node problems.
- yashvardhan-kukreja/kube-bench-exporter: Helps you to export your kube-bench reports to multiple targets like Amazon S3 buckets with ease.
恢复
- Backup and Restore of Kubernetes Stateful Application Data with CSI Volume Snapshots | by Zhimin Wen | ITNEXT
- Breaking down and fixing Kubernetes | by Andrei Kvapil | ITNEXT
部署
- Scaling Dedicated Game Servers with Kubernetes: Part 1 – Containerising and Deploying | Compound Theory
- Scale Kubernetes on multiple clusters and across clouds
- Kubernetes Kpt in the Wild: What it is and how to use it
- 万字长文详解 PaaS toB 场景下 K8s 离线部署方案 | 木子
自动扩容
- Guide to Kubernetes Autoscaling for Cloud Cost Optimization - CAST AI
- Architecting Kubernetes clusters — choosing the best autoscaling strategy
- Resizing StatefulSet Persistent Volumes with zero downtime | by Matías Costa | ITNEXT
- dignajar/another-autoscaler: Another Autoscaler is a Kubernetes controller that automatically starts, stops, or restarts pods from a deployment at a specified time using a cron expression.
资源管理
资源回收
- Using Finalizers to Control Deletion | Kubernetes
- K8S镜像删除及环境清理_weixin_30335353的博客-CSDN博客
- 删除并清理rancher节点_java_yuan12138的博客-CSDN博客
工具
- ssup2/kpexec: kpexec is a kubernetes cli that runs commands in a container with high privileges.
- Useful Tools for Better Kubernetes Development | by Yitaek Hwang | Noteworthy - The Journal Blog
- deckhouse/deckhouse: Kubernetes platform from Flant
- Pscheidl/kubexplorer: Detects orphan configmaps and secrets in a Kubernetes cluster
SRE
可靠
故障诊断
压力测试
备份
网络工具
k8s消息
- bitnami-labs/kubewatch: Watch k8s events and trigger Handlers
- weaveworks-experiments/kspan: Turning Kubernetes Events into spans
软件管理
- arminc/k8s-platform-lcm: A faster and easier way to manage the lifecycle of applications and tools, running and living around your Kubernetes platform
- arminc/k8s-platform-lcm: A faster and easier way to manage the lifecycle of applications and tools, running and living around your Kubernetes platform
多集群应用
集群管理
- loft-sh/vcluster: vcluster - Create fully functional virtual Kubernetes clusters - Each vcluster runs inside a namespace of the underlying k8s cluster. It's cheaper than creating separate full-blown clusters and it offers better multi-tenancy and isolation than regular namespaces.
- Multi-cluster Communication and Observability of GDPR Data with Linkerd
- kubermatic/kubecarrier: KubeCarrier - Service Management at Scale
- moule3053/mck8s: mck8s: Orchestration platform for multi-cluster k8s environments
集群测试
- Using kubernetes custom resources to manage our ephemeral environments | by Peter Hewitt | Beam Dental | Medium
- A Better Way of Organizing Your Kubernetes Manifest Files | Boxunix
公共组件
数据库
- Point-In-Time Recovery in Kubernetes Operator for Percona XtraDB Cluster - Architecture Decisions - Percona Database Performance Blog
- kloeckner-i/db-operator: The DB Operator creates databases and make them available in the cluster via Custom Resource.
- Autoscaling Databases in Kubernetes for MongoDB, MySQL, and PostgreSQL - Percona Database Performance Blog
数据迁移
- Database migrations on Kubernetes using Helm hooks | by Mathieu Dubois | ITNEXT
- MySql&MongoDB in Kubernetes .NET Core Angular Microservices | ITNEXT
入门
- A bit of Istio before tea-time
- 10 Anti-Patterns for Kubernetes Deployments | by Becca Bau | Better Programming
- https://learnk8s.io/research
oci
- OCI Artifacts Explained. Are they real? Kind of! | by Dan Lorenc | Jun, 2021 | Medium
- Using a ConfigMap as an OCI Image Cache · Daniel Mangum
机械学习
- LyftLearn: ML Model Training Infrastructure built on Kubernetes | by Vinay Kakade | Lyft Engineering
图形化
- viralpoetry/kubesurveyor: Good enough Kubernetes namespace visualization tool
- hjacobs/kube-ops-view: Kubernetes Operational View - read-only system dashboard for multiple K8s clusters - kube-ops-view - Codeberg.org
- prymitive/karma: Alert dashboard for Prometheus Alertmanager
- benc-uk/kubeview: Kubernetes cluster visualiser and graphical explorer
- kvdi/kvdi: A Kubernetes-native Virtual Desktop Infrastructure
应用
- kvdi/kvdi: A Kubernetes-native Virtual Desktop Infrastructure
- NVIDIA/k8s-device-plugin: NVIDIA device plugin for Kubernetes
- zalando/postgres-operator: Postgres operator creates and manages PostgreSQL clusters running in Kubernetes
grpc
自动更新
清理
- https://kubernetes.io/blog/2021/05/14/using-finalizers-to-control-deletion/