Batch correction - strange convergence
Hi, I found out something strange when using batch correction.
These are the two result from Muraro (pancreas) and MacParland (liver) datasets.
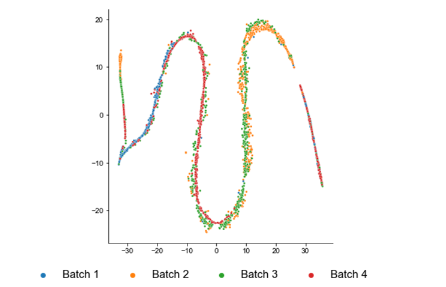
This is from Muraro
 and this is from Macparland
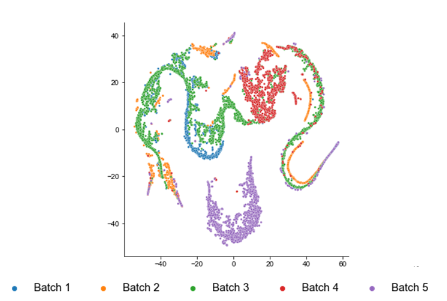 Each had 4 and 5 donors respectively.
The commnad I used is the following:
Each had 4 and 5 donors respectively.
The commnad I used is the following:
RunGLMPCA(obj, X=model.matrix(as.formula('~factor(batch)'))
The result is less strange when I remove the batch covariate matrix X from the model but the result is without batch correction.
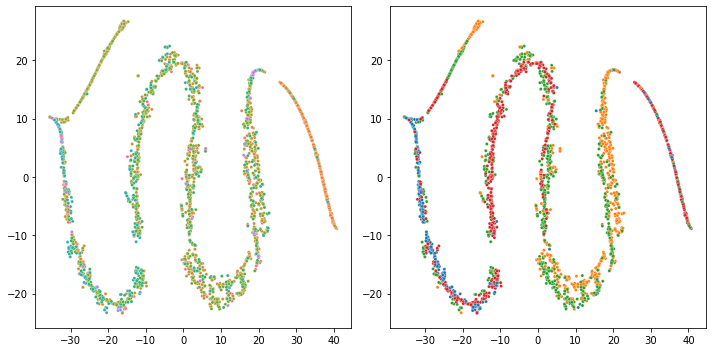
For example, the Muraro et al.'s pancreas dataset
 the batch effect is present (in orange) but the overall result look less weird.
Any solutions possible at this time?
Hello and thanks for trying glmpca. That is indeed a weird result! To be honest I have not thoroughly tested the batch correction feature. However, I suspect there is a numerical problem. By default, glmpca will subtract off the column means of the covariates matrix X and tack on a column of all ones. Since your provided model.matrix is going to already have a column of ones, I believe this is creating a duplicate column of ones. This collinearity is likely to cause numerical problems. Please try the following and let me know what happens:
X<-model.matrix(as.formula('~factor(batch)')
RunGLMPCA(obj, X=X[,2:ncol(X)])
In case you are interested here is the relevant part of the code.
Note to self, it would be good to check for this condition and drop the extra column automatically in the initialization code.
I have tested after dropping the first column as you suggested but getting something nearly the same:
The code:
X <- as.matrix(model.matrix(as.formula('~factor(donor)'), [email protected]))
X <- X[,2:ncol(X)]
pbmc_gpca <- RunGLMPCA(pbmc, L=30,
                       X=X,
                       sz=size_factor)
Yikes, still pretty weird! What happens if you set L=2 and/or set the learning rate to something small like .0001 ? To do the latter, you can pass it in as the "ctl" list ctl=list(lr=.001). The learning rate default is normally 0.1. And how many features (genes) are in the pbmc matrix?
I supplied 2000 features (feature selection was performed using Seurat's default vst) . By the way, I really thank you for the super fast replies. Trying adjusting the lr.
p.s. The resulting plots are GLM-PCA supplied to t-SNE (python openTSNE) with default settings.
Ohhh, that makes more sense that they are from tSNE. Please try modifying the perplexity parameter on the tSNE to see if that makes a difference. It might also be worth trying the Rtsne package and one of the UMAP implementations with glmpca initialization just in case there is a bug in openTSNE. I have seen tSNE sometimes do weird stuff even with standard PCA initializations. If you run GLM-PCA with L=2 you can directly visualize the latent space without needing to pass to tSNE, so that should also be helpful to compare.
 Adjusting the learning rate didn't help (X with dropped intercepts, openTSNE)
The next figure was produced after reducing the perplexity but still the same
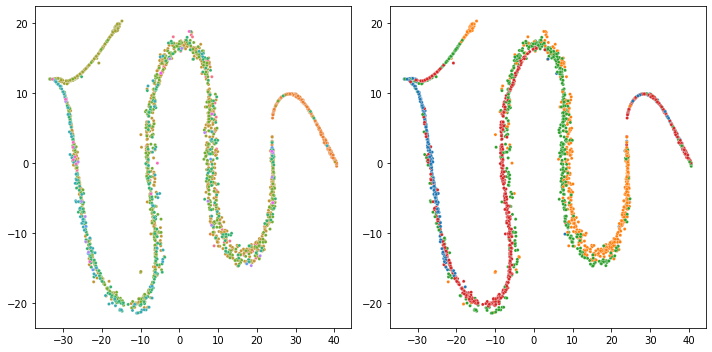
This one is a pure GLM-PCA with L=2
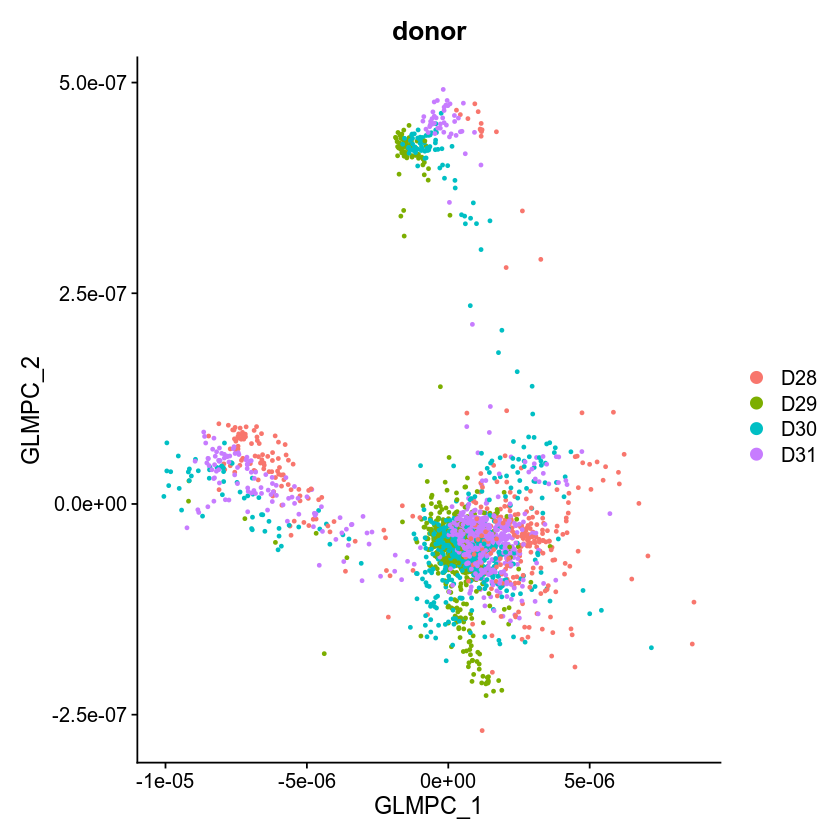 which looks OK.
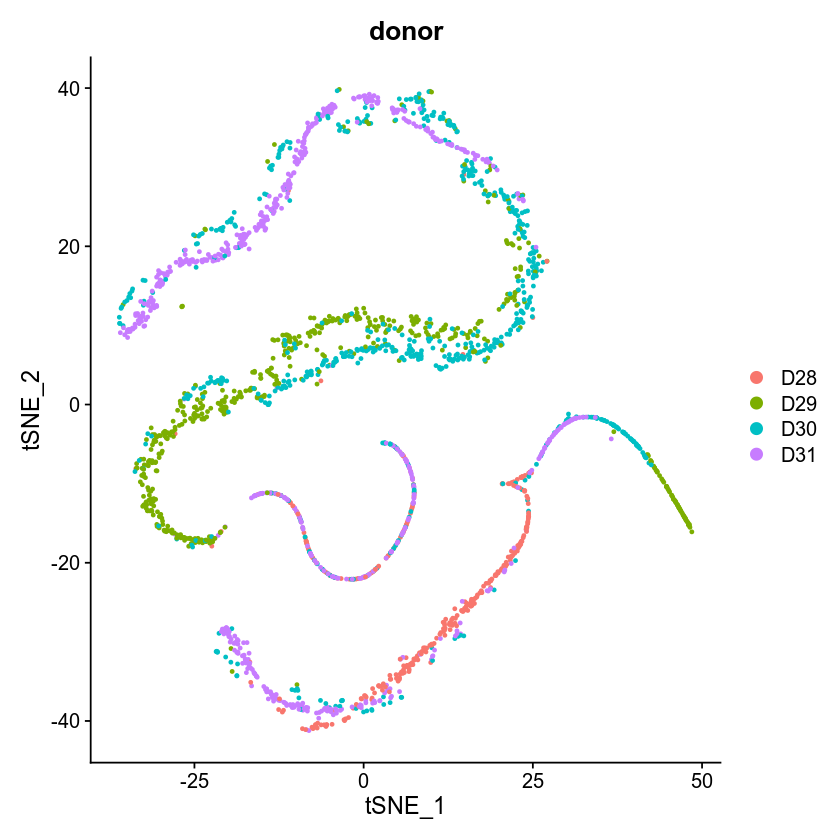
This one is GLM-PCA (X with dropped interceps, reduced lr to 0.001, Seurat TSNE) + TSNE which is clearly strange
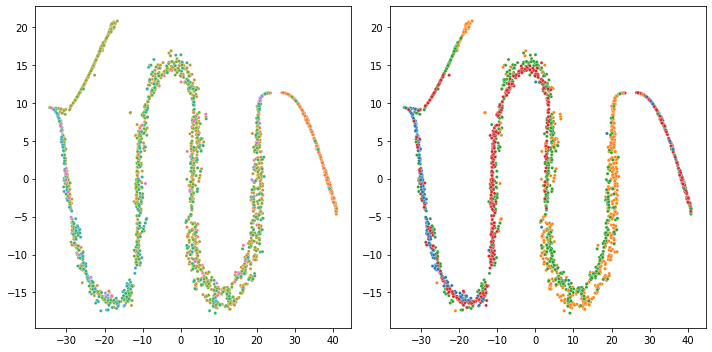
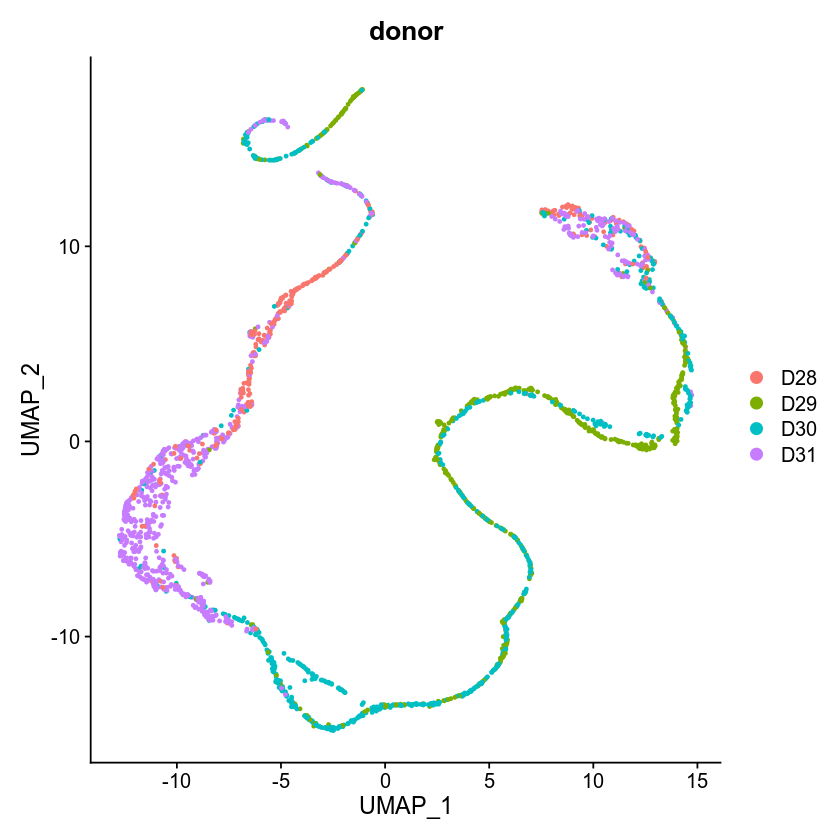
This one is GLM-PCA + UMAP (other parameters are the same with the previous TSNE setting)
I think learning rate nor the specific tSNE implementation nor the UMAP implementation is the problem. Probably L>5~10 + batch matrix is not working properly in the current implementation.
Sorry, I haven't had a chance to work on this, and probably won't for some time. If anyone else gets a chance to figure it out I'd be curious to know what's going on!
Not sure but may be some initialization scheme through (computationally much cheaper) PCA might help. Is there an option in GLM-PCA that takes initial latent coordinates?
Yes, there is an option called init where you can pass in pre-estimated factors, loadings, or both. I have tried it a few times but usually it takes just as long (if not longer) to converge than using a random initialization.