grid in background
Hi Will,
I use your gggeo_scale_old() function a lot to build time tables of fossil occurrences - and I absolutely love it! I have a suggestion, which I think could be helpful for other users as well: To better see whether a data point is part of a certain age interval a 'grid' in the background could be helpful. This would just be vertical or horizontal lines that needed to be plotted behind everything else and the option could be put be put as an argument of the gggeo_scale_old() function (or the up to date one). I would now do this in Inkscape afterwards or manually put lines in ggplot. I attached an image of how it could look like.
Best wishes,
Mario

Thanks for using deeptime, and I'm glad it's been useful!
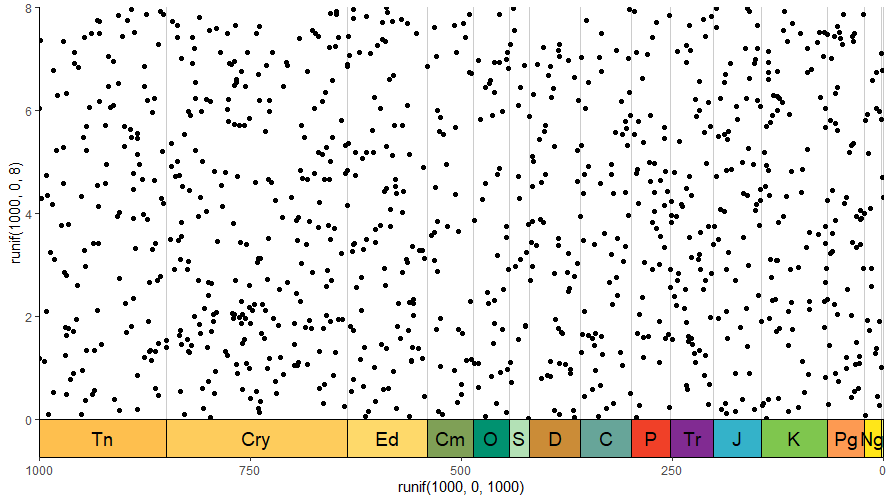
The timescale that deeptime uses is available in the user's environment. It's entirely possible you're already aware and doing something like this, but for the record, it should be fairly easy to add lines like this using code like this (specifically the geom_vline() line):
ggplot() +
    geom_vline(data = periods, aes(xintercept = min_age), color = "grey80") +
    geom_point(aes(y = runif(1000, 0, 8), x = runif(1000, 0, 1000))) +
    scale_x_reverse() +
    coord_geo(xlim = c(1000, 0), ylim = c(0,8)) +
    theme_classic()
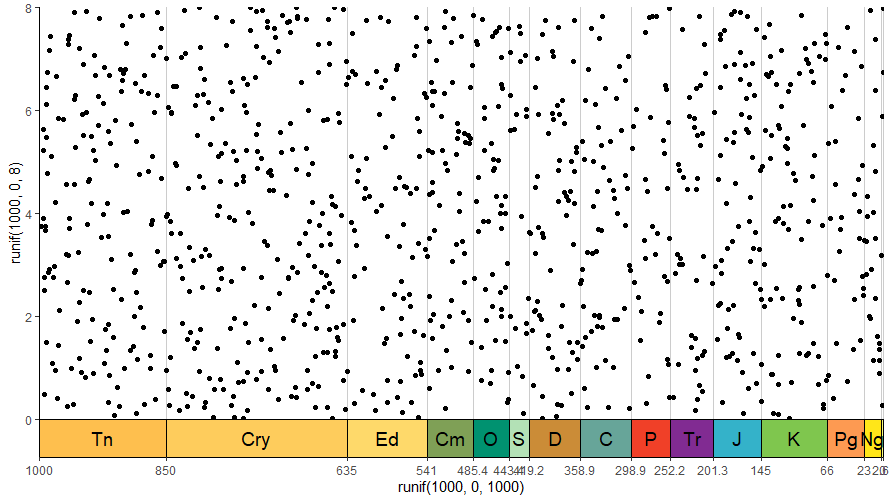
Another option would be to use the gridlines to your advantage, although this could get messy with closely spaced time periods:
ggplot() +
    geom_point(aes(y = runif(1000, 0, 8), x = runif(1000, 0, 1000))) +
    scale_x_reverse(breaks = periods$min_age, labels = round(periods$min_age, 1)) +
    coord_geo(xlim = c(1000, 0), ylim = c(0,8)) +
    theme_classic() +
    theme(panel.grid.major.x = element_line(color = "grey80"))
Since coord_geo() is only a coordinate system, I don't think I could add lines like this as part of it (I can only change the rendering of the axes). It certainly would be possible as part of gggeo_scale_old(), since that just adds rectangles and text on top of the existing ggplot, but gggeo_scale_old() is basically deprecated at this point, with coord_geo() being favored over both gggeo_scale_old() and gggeo_scale() (although neither of those are disappearing any time soon, so you don't need to worry about your existing code). Furthermore, aesthetically speaking you'd probably want the lines underneath your actual data, which gggeo_scale_old() would not be able to facilitate.
Given the two options above are probably just as easy as me adding a whole other function to do this, I'm going to label this "wontfix" for now, but I'll keep the issue open to keep me thinking about it.
I've realized I could override the render_bg() function for coord_geo() to do something custom here, but I'm not sure what that override would do, since you can already add the gridlines to the major and/or minor tick marks by default (see the second example above). Is there something beyond this behavior that we would want specifically for coord_geo()?
I'm going to close this for now, but let me know if you have any addition comments @mcranium