Inspect not working
Environment (please complete the following information):
- WebdriverIO version: 5.15.7
- Mode: WDIO Testrunner
- If WDIO Testrunner, running sync/async: async
- Node.js version: v10.13.0
- NPM version: 6.7.0
- Browser name and version: Chrome 78.0.3904.108
- Platform name and version: macOs 10.15.1
- Additional wdio packages used (if applicable):@wdio/selenium-standalone
Config of WebdriverIO
exports.config = {
    runner: 'local',
    specs: [
        './test/specs/**/*.ts'
    ],
    exclude: [
        // 'path/to/excluded/files'
    ],
    maxInstances: 10,
    capabilities: [{

        maxInstances: 5,
        browserName: 'chrome',

    }],

    logLevel: 'trace',
    bail: 0,
    baseUrl: 'localhost:8100',
    waitforTimeout: 10000,
    connectionRetryTimeout: 90000,
    connectionRetryCount: 3,
    services: ['selenium-standalone'],
    framework: 'mocha',
    reporters: ['spec'],
    mochaOpts: {
        ui: 'bdd',
        timeout: 60000
    },
    before: function (config, capabilities, specs) {
        require('ts-node').register({
        project: './test/tsconfig.e2e.json'
        });
    },
}
Describe the bug Tried to stop the tests for inspection as written in the official docs The tests are not stopping.
To Reproduce
Steps to reproduce the behavior:
./node_modules/.bin/wdio ./test/conf/wdio.conf.js --inspect-brk
Expected behavior The tests stop on the first line.
What is first line?
According to the docs, adding --inspect-brk flag stops the tests on the first line. I guess that means the first line of the tests?
What is first line?
According to the docs, adding
--inspect-brkflag stops the tests on the first line. I guess that means the first line of the tests?
Precisely. Am I reading it wrong?
I think it may not work like this. Wdio spawns at least two processes, main and worker. Tests runs in worker process that is a fork of main process. So you have 2 nodejs instances and 2 ports opened, you have to connect to second one. Worker process port gonna be main port + 1 It would be easier to add browser debug somewhere in your code and try connecting to worker process
@baruchvlz I'd be glad to push a PR but I still have to grasp how the --inspect[-brk] works so I can edit the doc file (please check that's the right file)
So, let's start :)
- is It still a good practice to use
--inspectand--inspect-brk? - if yes, what's the way of using it and when should it be used? Can you suggest an example with working code?
- if no, should I remove the paragraph or add a deprecated comment?
These questions, I think, are best answered by @mgrybyk or @christian-bromann. As far as I know, there is no --inspect flag currently in the CLI. The same behaviour can be done by adding browser.debug() as suggested in an earlier comment.
In my opinion, we shouldn't use either flag anymore as it can cause confusion of when the tests should stop especially when working with multi-remote. I think we should update the docs so instead of suggesting to use --inspect it should say to use browser.debug() (also explain how to continue the tests after debugging.
@mgrybyk I'm going to re-open this issue so we can keep track of the doc changes and to avoid it getting lost in the closed issues.
A recent blog post talks about a very similar issue with a different node.js project. Same idea with multiple Node processes being spawned and how the correct one was targeted I a smooth workflow like fashion. Might be helpful. https://blog.june07.com/socket-watcher/
I'm having the same problem with the --inspect/--inspect-brk options. Honestly I think this is a HUGE problem if compared to wdio 4, and despite my personal opinion I'd suggest finding a solution in order to prevent people from abandoning this beautiful framework.
All complex tests rely on page objects and require a powerful debugging support, REPL is not enough when you have page objects with many methods, inheritance etc.
What I do with v4 is: stop the execution with browser.debug() and then use chrome dev tools to debug node and call or check my page object methods (this is why I use the --inspect flag in order to start node in debug mode).
How can we achieve the same result with wdio 5?
@mcelotti @edoardoo @baruchvlz
IDE
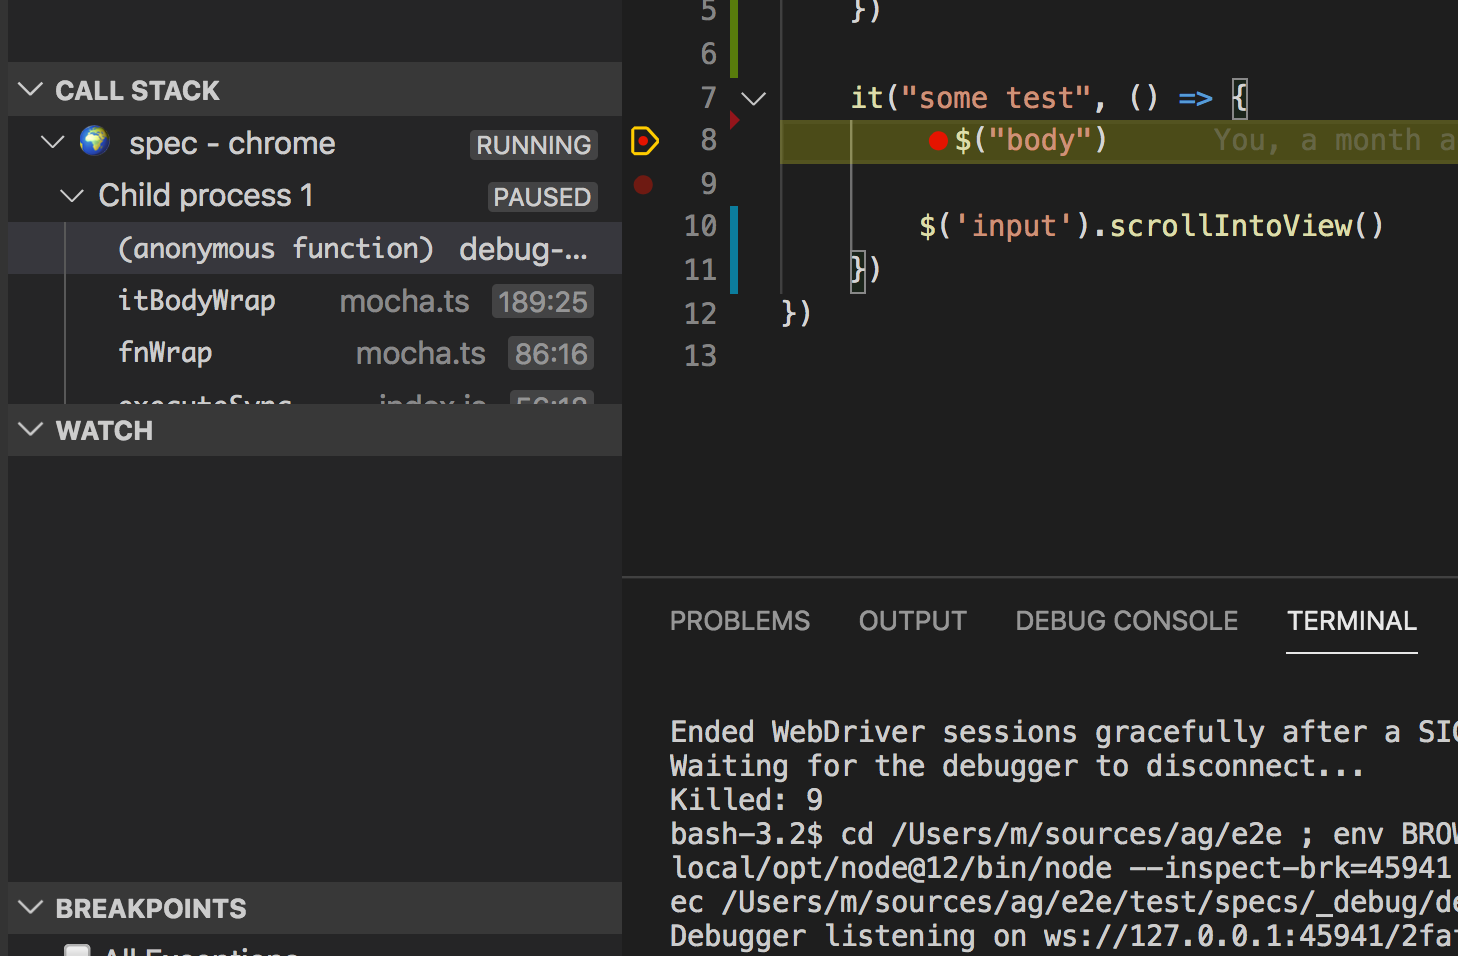
I'd recommend to debug with IDE instead, it's way more comfortable, for example in VSCode https://webdriver.io/docs/debugging.html#debugging-with-visual-studio-code-vscode. Just set breakpoint and go ahead!
 P.S. when node-fibers will be replaced with deasync debugging becomes even more easier https://github.com/webdriverio/webdriverio/pull/4886
browser.debug
browser.debug() works just fine in v5, the execution stops as expected.
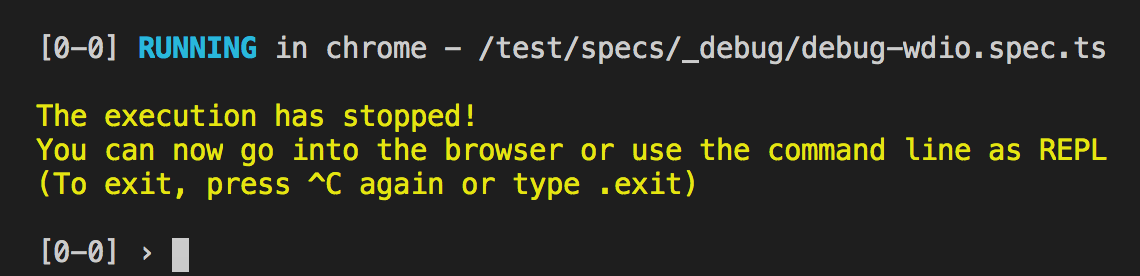 Just hit ctrl+c twice to proceed execution
inspect-brk and Chrome
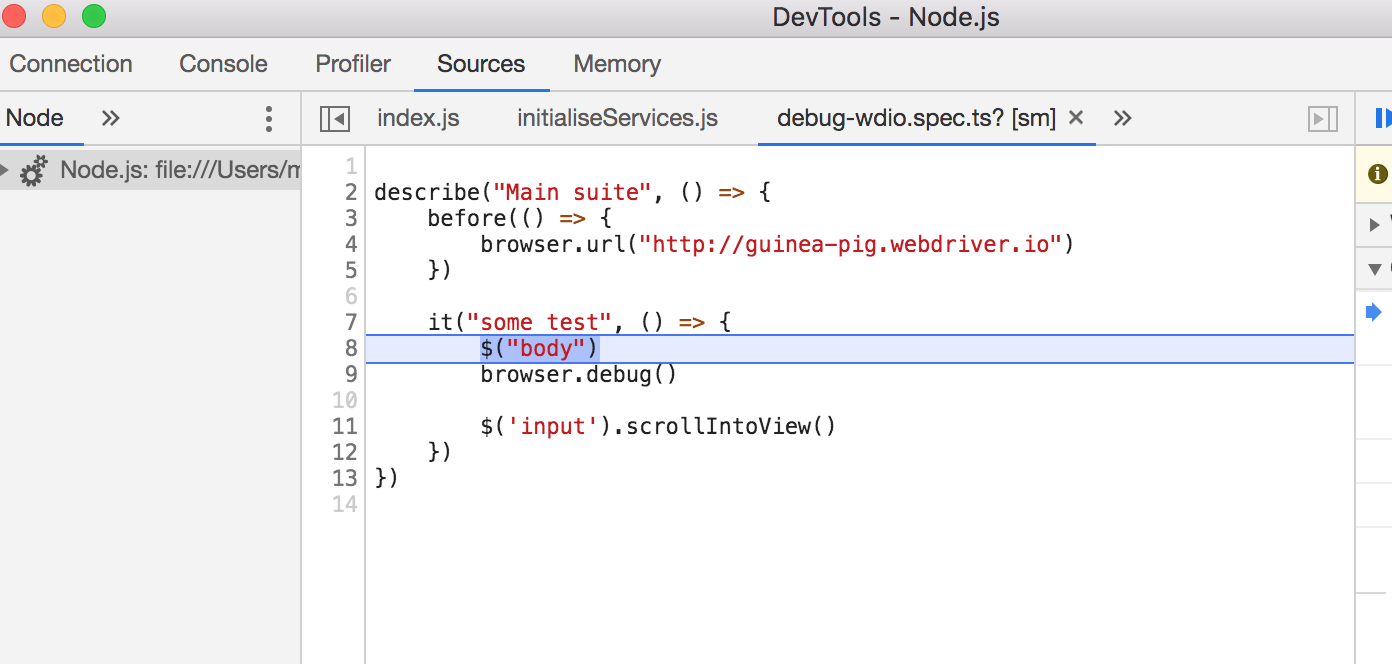
Finally webdriverio is built on top of nodejs and you can debug it as a regular nodejs app that spawns child processes. Feel free to use chrome dev tools or any other debugger.
Add --inspect-brk=some_port when running wdio cli, ex node --inspect-brk=9229 node_modules/@wdio/cli/bin/wdio.js you'll see Debugger listening on ws://127.0.0.1:9229. The port corresponds main process, every child process starts on main process port + 1
(NOTE: modern IDEs do that for you)
- open
chrome://inspect/#devices - Open dedicated DevTools for Node
- connect to localhost:9230 (in this case)
Hi @mgrybyk and thanks for your support.
VSCODE IDE I tried that, had some problems with some sort of "freeze" behaviour but I did not investigate too much since I'd prefer using chrome dev tools so debugging is not related to some specific IDE (we're using webstorm by the way).
BROWSER.DEBUG As I said this is not really handy since we rely on page objects and we need to have access to many variables and methods
INSPECT-BRK AND CHROME I tried your procedure but I can't get the debugger to stop at my breakpoints. Here's what I do:
-
(terminal 1)
npx selenium-standalone start -
(terminal 2) node --inspect-brk=9229 node_modules/@wdio/cli/bin/wdio.js wdio.conf.js
Then I open chrome://inspect/#devices and click on the only node process I have in order to resume execution. The test starts and stops at my "browser.debug()" so now I have the time to click on the 2nd process I have in chrome://inspect/#devices. I open the 2nd chrome dev tools, set a breakpoint after the "browser.debug()" line, go back to my terminal and type ".exit" to exit "browser.debug()". At this point the test completes and my breakpoint is ignored. What am I doing wrong?
Thanks
No idea, I'd suggest seeing nodejs docs, as far as wdio is just a nodejs app. I've personally tested all methods and all of them works fine for me both with wdio and any other nodejs app.
Try using IDE, the approach with vscode works like a charm. At this point you can't execute browser command when process is paused on breakpoint in sync mode, but it's gonna be fixed in the PR mentioned in my previous comment
Yes that would be great, but it would be even better a PR to add your inspector+chrome procedure on the official debug page in order to show code/page object inspection. Thanks man!
Does this help? You can see in the example that I'm using DevTools and my debugger breakpoints in my test file (browser process) are correctly paused on.
Hi @june07, thanks for the video! I tried your setup and the idea of using NiM is great because I can get rid of "browser.debug()" since the node inspector opens automatically. Unfortunately the whole process is buggy, most of the times the debugger stops for 0.1 sec and then disconnects automatically. After some runs it stopped correctly (like in your video), but then console interaction was poor, ie: looks like async commands can't be executed, in fact after some commands I had to kill the node process with a "kill -9" because it got stuck (I think this is related to what @mgrybyk wrote about sync mode). I tested with both chromedriver and selenium-standalone services, same result. Anyway this is the closest to my goal ever, because at least I was able to work with the right context (ie see test vars and methods). Too bad I can't trust the execution since the debugger most of the times disconnects automatically and the async commands can't be evaluated in the console.
I really appreciate your help, let's hope this whole thread is gonna be useful to other people! Thanks
Here's the video:
I just actually responded to someone else about this so it could be that it helps in your case too.
If you are experiencing DevTools oddities, try changing the DevTools version in the NiM settings like:
 You may find that the console interaction is more to your liking, async commands work, etc. The previous user I spoke of was having problems with missing syntax highlighting but when changing the version of DevTools, it resolved his issue.
More info is here https://blog.june07.com/nim-custom-devtools-url/ but the long and short of it is that DevTools versions often change and being able to pin your environment to a specific version is helpful.
I tried your custom devtool (https://chrome-devtools-frontend.appspot.com/serve_file/@548c459fb7741b83bd517b12882f533b04a5513e/inspector.html) but I get the same result, it disconnects right away :(
Here's a workaround for using the node-inspect debugger. (Simply adding only execArgv: ['inspect'] didn't work in my environment.)
- Add a flag for node in the WebdriverIO configuration
execArgv: ['--inspect'], - Run wdio with the following command
wdio --spec foobar.js & sleep 2; node inspect -p $(pgrep -f "node --inspect")
The key is to delay the attachment with node inspect. Sleep time should be adjusted as needed.
Note that this command assumes that there is no other process running on the node --inspect. If you have them, change the way you get the PID.
NiM also has a new auto resume from -inspect-brk feature as well as other bug fixes since my last update to this thread. https://twitter.com/june07t/status/1269307428543184896?s=19
Hi, I tried the workaround @saito-tom suggested and it works.
The NiM starts correctly and stops at the "debugger" statement.
Anyway when I try to execute a live command (ie: "browser.getTitle()") I just get a pending request and no results, here's a screenshot.
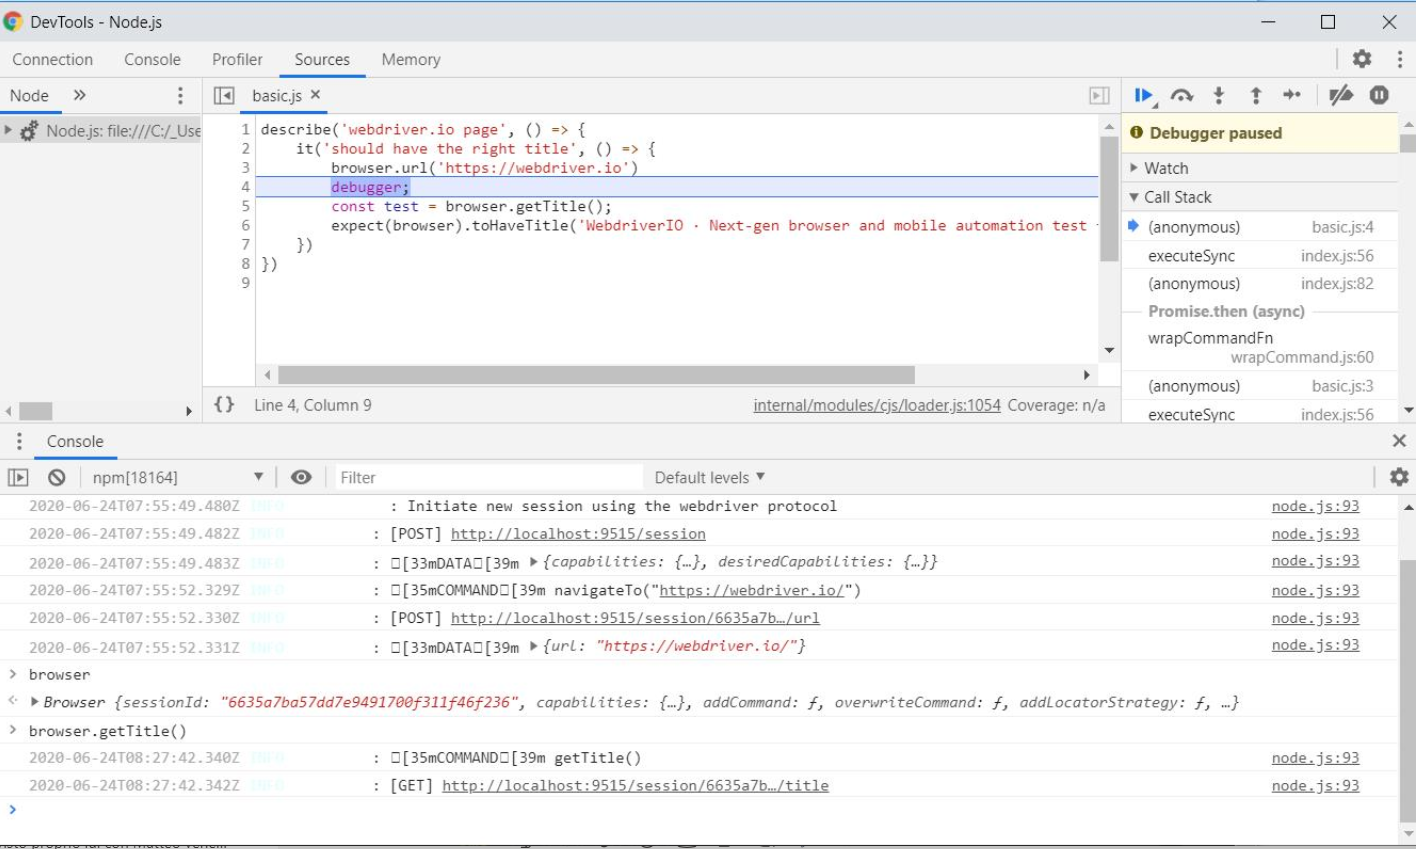 On the wdio 4 I'm able to test the live commands using the console, any hints to get the same behaviour on wdio5?
Thanks
I just came across this issue when searching for a solution for our debugging problem. This is also a problem for us to not being able to debug in a usual manner. Is it planned to fix this bug in near future?
Hi, in some of our projects we are currently using webdriverio. Currently we need to debug our e2e tests and we are encountering the same issue. Is there any progress or planned action on this issue?
Is there any progress or planned action on this issue?
As the labels of this issue state: please get involved and help us fix the issue, thanks!
For anyone interested, please checkout the updated debugging guide: https://webdriver.io/docs/debugging
I have given it an update a while ago, if you still have any issues after going through those steps. Please post here or I'll close the issue sometime soon.