wpt.fyi
 wpt.fyi copied to clipboard
Migrate from Google Universal Analytics to Google Analytics 4
Current state of the Analytics System
Currently, we leverage Universal Analytics which is due for deprecation in favor of Google Analytics 4. There is a guide of how to migrate to Google Analytics which involes making changes to the existing gtag.js script. However, our implemenation of Universal Analytics uses analytics.js. Analytics.js is a dated version of and should migrate to gtag.js before migrating directly to Google Analytics. This document demonstrates the migration path and differences.
Detailed Plan
- [x] 1. Migrate existing analytics.js script to gtag.js for Universal Analytics. #2917
- [x] Switch to using tracking code that uses gtag.js
- [x] Change all custom events that use
window.gaorgatowindow.gtagorgtag - Notes:
- No longer need to explicitly send page view events in gtag.js
- Events have a different format (1) (2)
- Exceptions have a different format in terms of the exception parameters.
- [x] 2. Add additional configs to send information to the new Google Analytics 4 properties while also sending data to the existing Universal Analytics property. #2917
- Might be advantageous to setup Google Tag Manager to manage environments automatically later on. #2919
- [ ] 3. Once confimed that everything works, remove the old Universal Analytics tracking code and keep only the Google Analytics tracking. #2921
cc: @past @DanielRyanSmith @KyleJu
After #2927 happened. It was confirmed that the Google Aanlytics 4 wptdashboard is now populating.
@jcscottiii do you have any theory as to why the two dashboards show different usage? Just looking at "all users" I see significant differences between the two charts.
For the universal analytics, by default it includes all traffic to any deployment of wpt.fyi (localhost, staging, prod, any custom deployments) I created a custom segment to filter only on production (https://wpt.fyi) traffic. Here's how to use it.
- Click on the "All Users" segment.
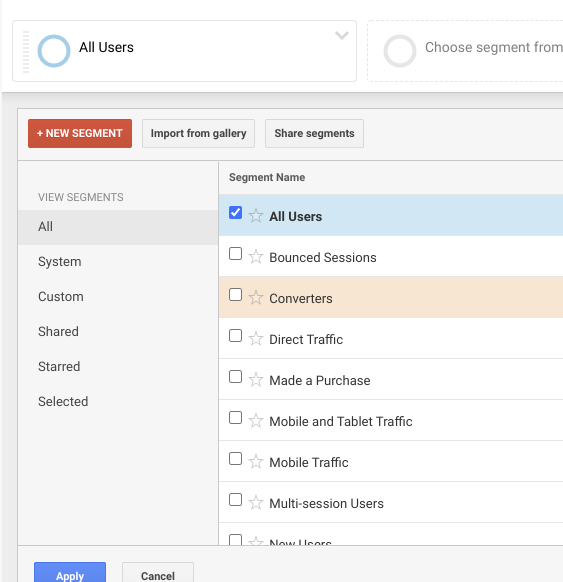
- Uncheck All Users
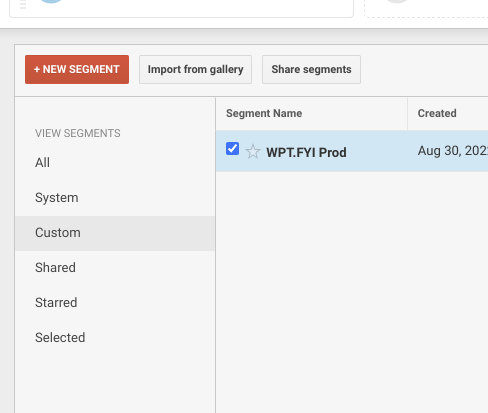
- Go to Custom and check WPT.FYI Prod
With that comparison you'll get:
| Service | Screenshot |
|---|---|
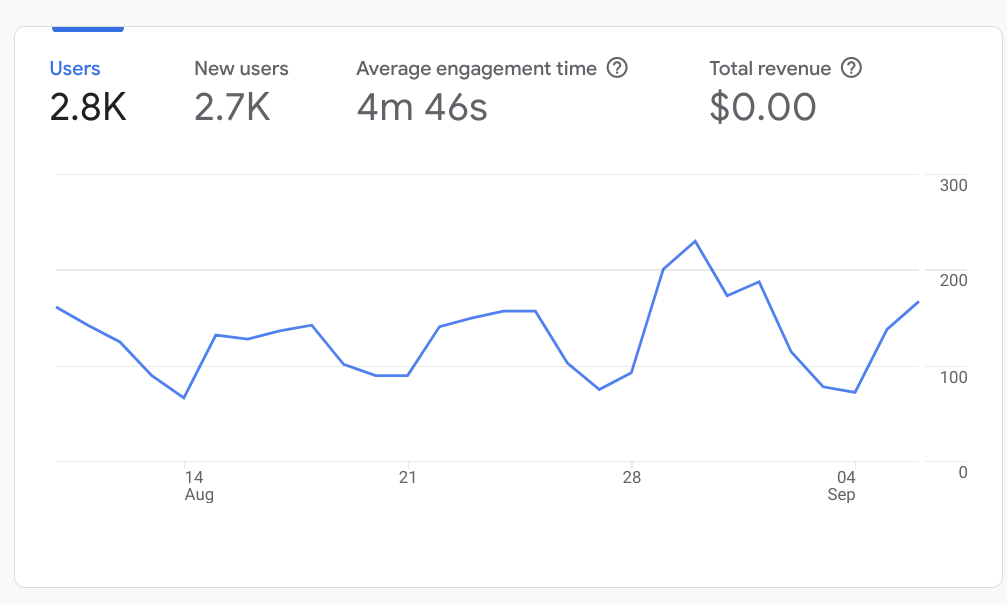
| Google Analytics 4 | 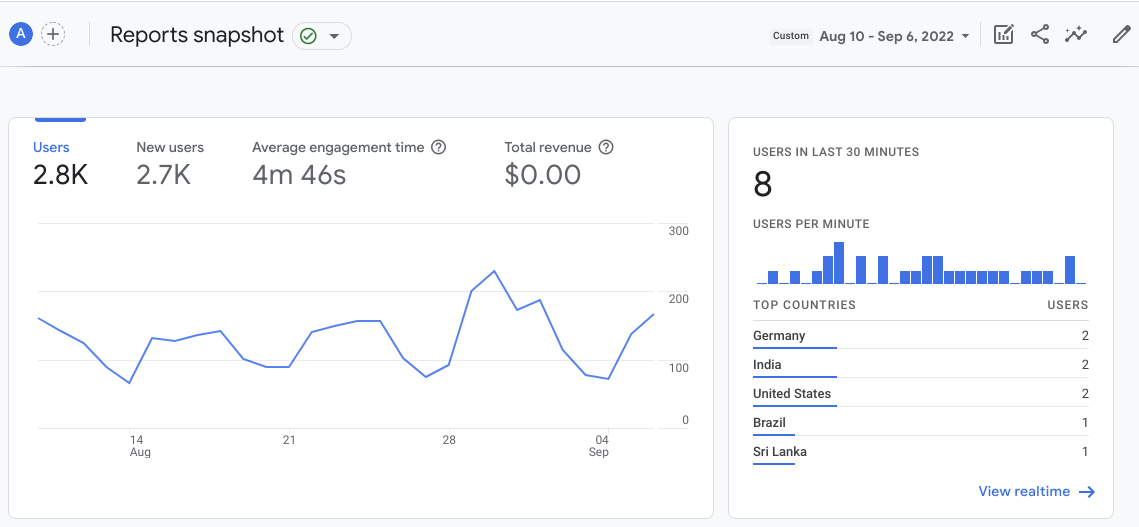 |
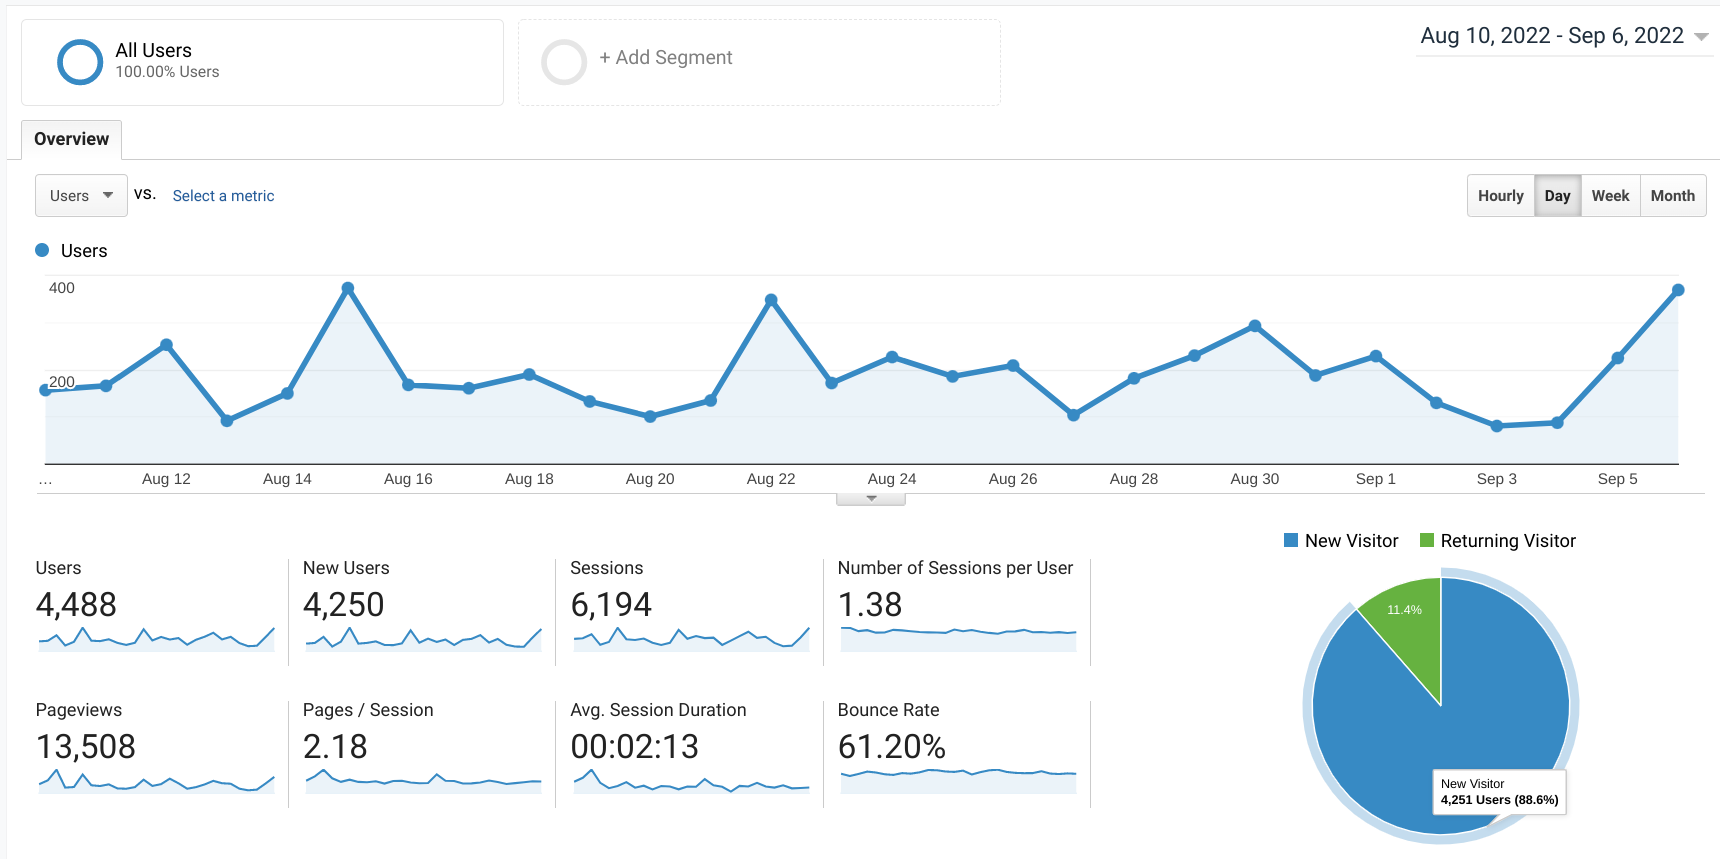
| Universal Analytics | 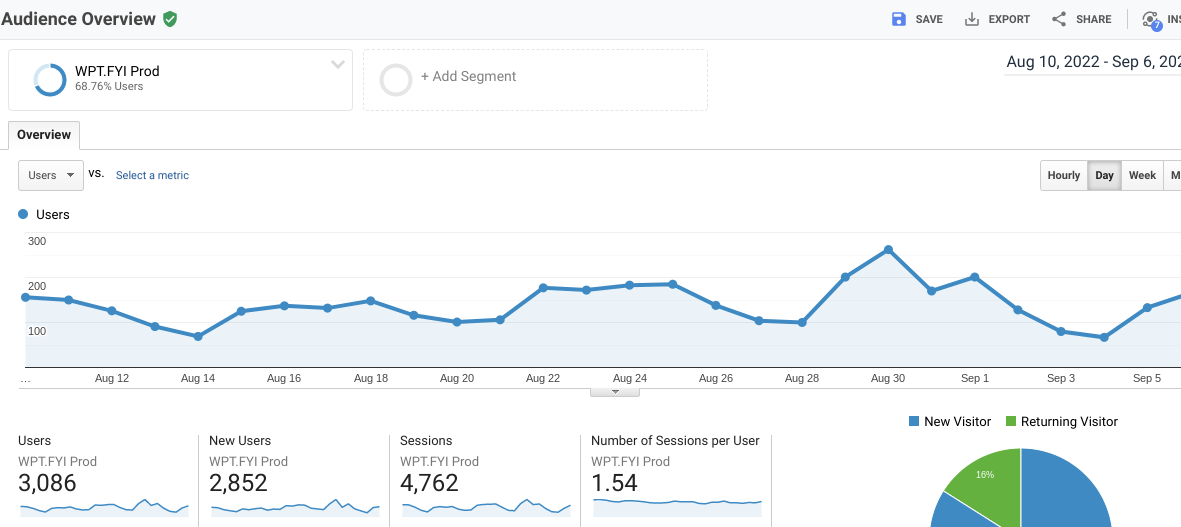 |
There's a 6% difference when focusing only on the traffic to wpt.fyi in Universal Analytics
I did some digging and found this article. Summarized it says: There is also a slight difference in the usage of "Users" between the Google Analytics 4 and Universal Analytics
- In Universal Analytics, "Users" means what you expect "Total Users"
- In Google Analytics 4, "Users" means "Active Users"
"Active Users" is measured by:
any user who has an engaged session or when Analytics collects the first_visit event or engagement_time_msec parameter from a website`
Now I am looking into the 6% difference. "Active Users" have to be engaging the page in some way to be counted. So my initial hypothesis is that part of that 6% difference is from users that do not do anything on the page. I started diving into this using the DebugView in Google Analytics
I did look at the Page Views metrics. There are some major differences there.
| Service | Screenshot |
|---|---|
| Google Analytics 4 | 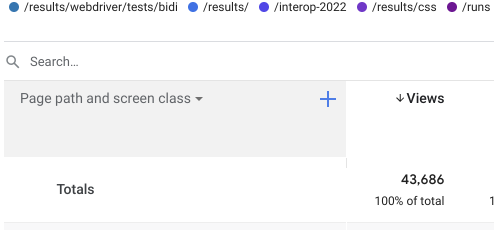 |
| Universal Analytics | 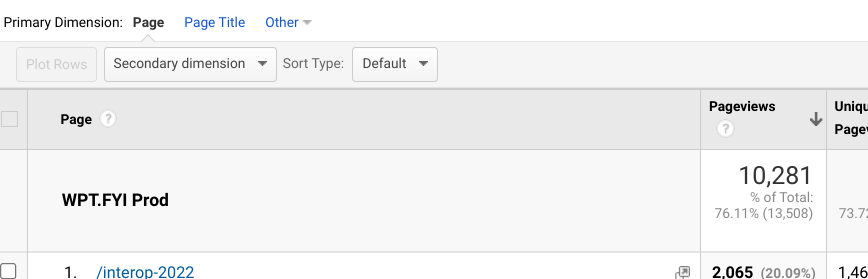 |
This one will take some more time to look into
This looks much more reassuring, thank you! In the link you shared I see this helpful paragraph:
You can compare Total Users from UA to Total Users in GA4 by using Explorations in GA4 to find your total users number. These numbers may be more comparable than the Users metrics in the GA4 reports due to the differences in definitions.
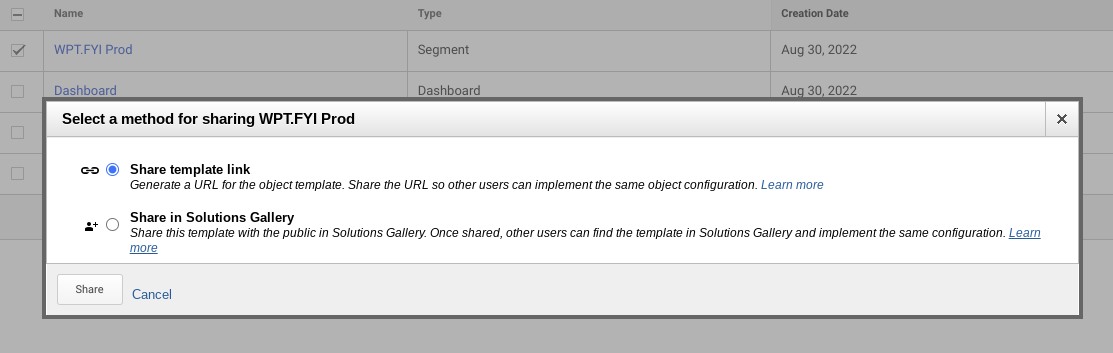
I created an exploration that showed a slightly elevated number of total users, although it didn't fully explain the 6% difference. By the way I couldn't find the WPT.FYI Prod segment in UA, maybe it needs to be shared first?
Anyway, I don't think the absolute values matter as much as the graph shape, which seems to be more or less consistent between the two after your production segmentation. Modulo your investigation uncovering any further discrepancies, I now feel much more confident about the collected data.
Here's the segment: https://analytics.google.com/analytics/web/template?uid=TRn3Ezh2Sj6phuBlI2DlQw
(Can only share by link or put it publicly in the Solutions Gallery for all Google Analytics users to import)
I like your comment about the shape of the graph. It makes sense. Given that Google Analytics calculates things differently, it is a good point to keep in mind.
I will update the thread on the pageview. I did some debugging this morning. Will post my findings soon.
Did some initial investigation. Seems like Google Analytics 4 right now is counting redirects as page views. This can lead to two views for a particular page (e.g Scenario 1). However, there are cases with the old Universal Analytics which are not counting some page views, thus missing data. (Scenarios 13 & 14)
Conclusion: I feel more confident that Google analytics 4 is better and if we needed to cut over today, I would be 100% okay with it since it is capturing all the data whereas Universal Analytics is missing page view counts. The only problem with Google Analytics 4 is the duplicate page views from redirects (but that is not a deal breaker unlike missing data). I will look into how to stop duplicate data from the redirects.
Raw Notes below:
| Scenario | Google Analytics 4 (new) | Universal Analytics (old) |
|---|---|---|
| Scenario 1. Going to the home page | counts as two page_views. https://wpt.fyi redirects to these two page_view events:
|
counts as one pageview event
|
| Scenario 2. Clicking on "Latest Run" from the homepage | Same as scenario 1 | Same as scenario 1 |
| Scenario 3. Changing the channel on the homepage between stable and experimental | Does nothing. As expected | Does nothing. As expected |
| Scenario 4. Clicking on "accelerometer" from the homepage to go to the accelerometer page | counts as one page_view
|
counts as zero page views BAD ❌ |
| Scenario 5. Clicking on "Accelerometer_insecure_context.html" from the accelerometer page | counts as one page_view.
|
counts as zero page views BAD ❌ |
| Scenario 6. Clicking the "Link" button and all the options | no page_view events. as expected since the page doesn't change | no page_view events. as expected since the page doesn't change |
| Scenario 7. In the edit panel, Removing a product and clicking a submit. In this case, I removed safari. | counts as one page_view.
|
counts as zero page views BAD ❌ |
| Scenario 8. Clicking "Show History" on a test page | does nothing as expected. | |
| Scenario 9. Clicking on a link that leaves the webapp (e.g. github) | yields no page_view events. That is expected | yields no pageview events. That is expected |
| Scenario 10. Clicking "Recent runs" in the top nav from scenario 9 page | counts as two page_views events
|
counts as one pageview event
|
| Scenario 11. Clicking on a SHA from the recent runs page | counts as two page_views events
|
counts as one pageview event
|
| Scenario 12. From the SHA page, click on the sha for a particular product. | ||
| Scenario 13. From the SHA page, clicking on accelerometer category | counts as one page_view.
|
counts as zero page views BAD ❌ |
| Scenario 14. From the SHA accelerometer page, clicking "Accelerometer_insecure_context.html" | counts as one page_view.
|
counts as zero page views BAD ❌ |
| Scenario 15. From the recent runs page clicking on a particular product, then click view run | counts as two page_views events
|
counts as one pageview event
|
| Scenario 16. Clicking on Interop 2022 in top nav | counts as one page_views event
|
counts as one pageview event
|
| Scenario 17. On the interop 2022 page, switching from experimental to stable | counts as one page_views event
|
counts as zero pageview events |
| Scenario 18. On the interop 2022 page, switching back to experimental from stable | counts as one page_views event
|
counts as zero pageview events |
| Scenario 19. On the interop 2022 page, clicking on the Cascade Layers category of tests | counts as one page_views event
|
counts as one pageview event
|
| Scenario 20. Clicking on Insights in top nav | counts as one page_views event
|
counts as one pageview event
|
Excellent write-up! I also feel comfortable with the migration now after this very thorough analysis.
I did some more analysis into the scenarios where it counts as two events. (1 redirect and 1 actual destination with the added query parameters)
Google Analytics 4 is acting as intended. I will move my PR from draft to ready.
Conclusion (tl;dr the details below)
The collection of the 2 page_event events (1 for the redirect and 1 for the final rendered page) paints a picture of two types of users: Users that just go to the default page vs users that know the query string parameters and navigate directly with all the query string parameters. By trying to remove one or deduplicate these, you would lose the ability to discover this trend.
More details below
Looking at the data
Keeping as-is allows us to see which users come to the page without any query parameters vs those that come with a full url with query parameters.
Creating a view to show query string parameter breakdown does not come by default. Following these directions, I was able to see the breakdown.

This difference is big enough to keep both events.
(I also modified the shared report for everyone to see by query string parameters)
Debug
I also did a debug session by placing a breakpoint here and using the Google Analytics Debugger extension
Upon going to localhost:8080.
- It redirects immediately to localhost:8080/results due to this line and the first google analytics event has fired
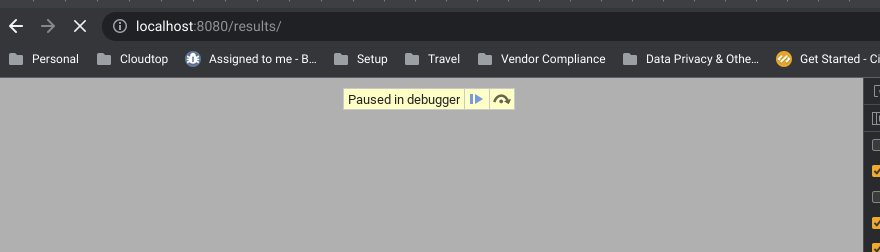
- A blank page renders
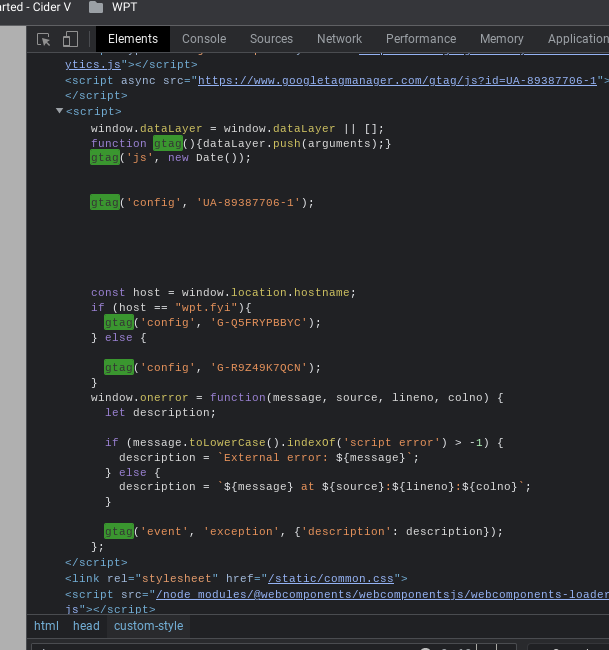
- But the page's header contains the google analytics configuration which allows it to trigger.
- The break point triggeres a bunch of times
- view=subtest is added first
- view=subtest is removed then ?label=experimental&label=master&aligned is added
- When the page finally finishes rendering, it sends the second event with the query string parameters