weave
 weave copied to clipboard
excessive memory usage
What you expected to happen?
RAM usage to not be excessive
What happened?
Over the course of less than three days of starting, I have seen 3 pods across 2 different clusters hitting over 20GB or memory
How to reproduce it?
I am not msure at the moment
Anything else we need to know?
Running on AWS, EKS with the weave manifests attached to a mesos cluster Running encrypted
Versions:
weave 2.7.0

docker version
Client:
 Version:           19.03.6-ce
 API version:       1.40
 Go version:        go1.13.4
 Git commit:        369ce74
 Built:             Fri May 29 04:01:30 2020
 OS/Arch:           linux/arm64
 Experimental:      false

Server:
 Engine:
  Version:          19.03.6-ce
  API version:      1.40 (minimum version 1.12)
  Go version:       go1.13.4
  Git commit:       369ce74
  Built:            Fri May 29 04:02:02 2020
  OS/Arch:          linux/arm64
  Experimental:     false
 containerd:
  Version:          1.4.1
  GitCommit:        c623d1b36f09f8ef6536a057bd658b3aa8632828
 runc:
  Version:          1.0.0-rc92
  GitCommit:        ff819c7e9184c13b7c2607fe6c30ae19403a7aff
 docker-init:
  Version:          0.18.0
  GitCommit:        fec3683

 uname -r
5.4.91-41.139.amzn2.aarch64


$ kubectl version

kubectl version
Client Version: version.Info{Major:"1", Minor:"19", GitVersion:"v1.19.3", GitCommit:"1e11e4a2108024935ecfcb2912226cedeafd99df", GitTreeState:"clean", BuildDate:"2020-10-14T12:50:19Z", GoVersion:"go1.15.2", Compiler:"gc", Platform:"darwin/amd64"}
Server Version: version.Info{Major:"1", Minor:"18+", GitVersion:"v1.18.9-eks-d1db3c", GitCommit:"d1db3c46e55f95d6a7d3e5578689371318f95ff9", GitTreeState:"clean", BuildDate:"2020-10-20T22:18:07Z", GoVersion:"go1.13.15", Compiler:"gc", Platform:"linux/amd64"}
Logs:
pprof
Thanks for opening the issue. Could you please re-upload the heap profile as a binary rather than text file, since it downloads as 29 bytes for me. You may need to zip the file before uploading for GitHub to accept it.
so here is something interesting that might be related ( we started to see this in one of our clusters again this morning)
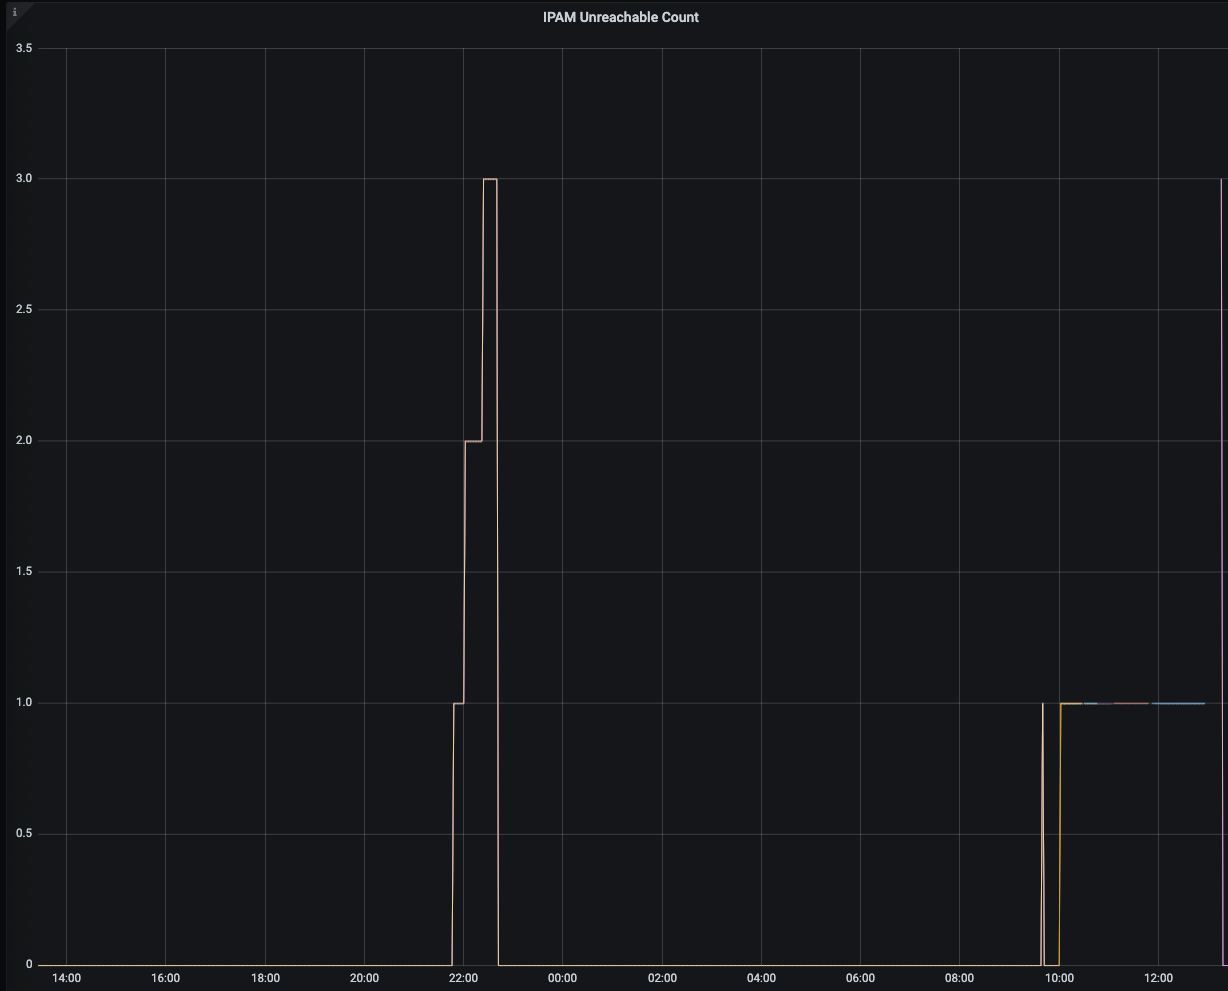
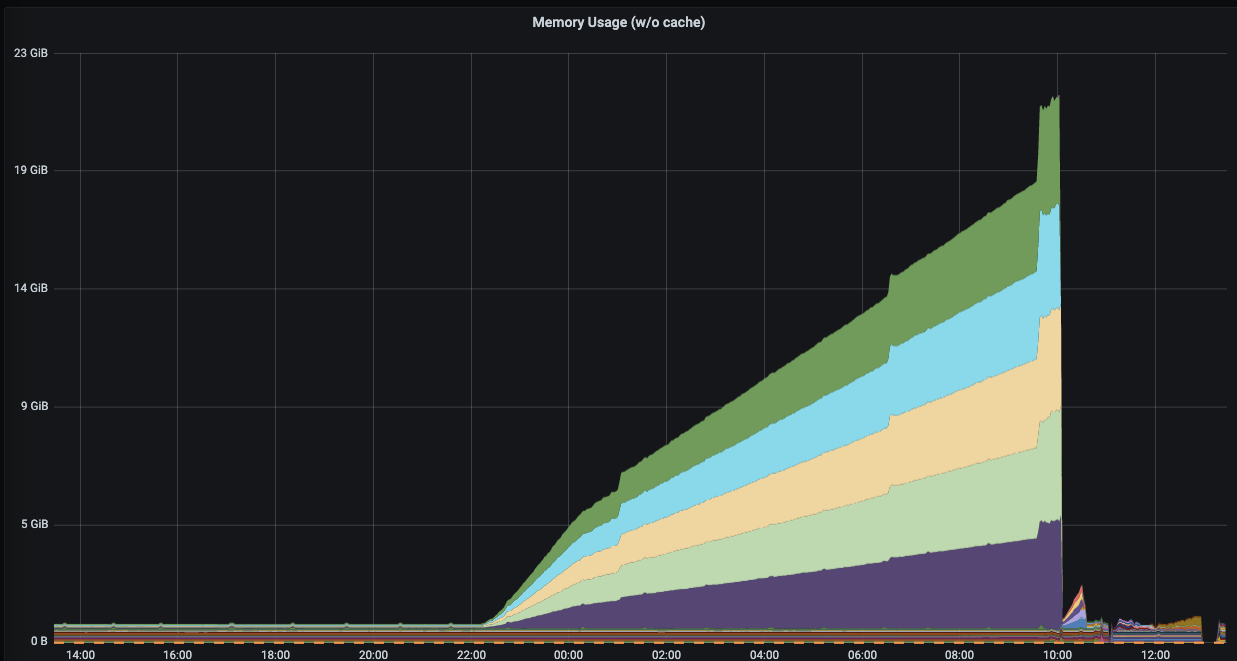
The first shows when we had some sort of ipam problem, the second graph shows the weave containers using more and more memory until we restarted them
Looks like something is locked up; can you supply the goroutine profile too please.
We killed all the nodes in the environment that this was happening in so I am going to have to wait until we see it again before I can grab that for you.
As a heads up, the way this cluster is running is there are 5 kubernetes nodes running weave-kube and 6 nodes running weave via systemd. We are using weave as a bridge between a kubernetes cluster and a mesos cluster as we migrate to kubernetes
Looks like I might have caught it early this time, this instance just launched
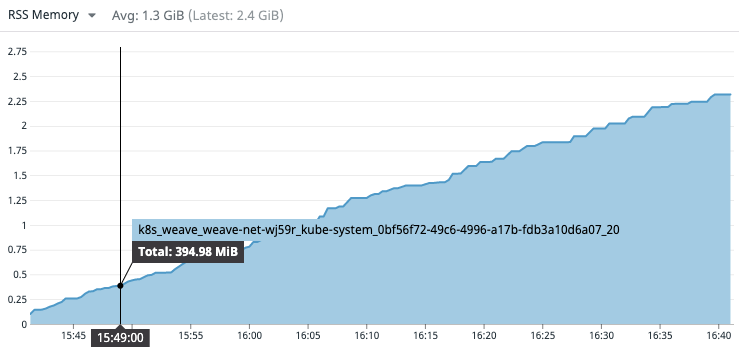
heap and goroutine dumps weave-dumps.zip
log files weave-net-wj59r.txt
@bboreham ☝️
That pod has been restarting a lot
weave-net-mltx6                                                  1/1     Running   2          6d3h
weave-net-qcq28                                                  1/1     Running   2          6d3h
weave-net-sfhjd                                                  1/1     Running   2          6d3h
weave-net-wj59r                                                  1/1     Running   20         24h
weave-net-zfsps                                                  1/1     Running   2          6d3h