wazuh-dashboard-plugins
 wazuh-dashboard-plugins copied to clipboard
Duplicated queries requests on dashboard load
| Wazuh | Elastic | Rev | Security |
|---|---|---|---|
| 4.3 | 7.x | 4xxx | Basic, ODFE, Xpack |
| Browser |
|---|
| Chrome, Firefox, Safari, etc |
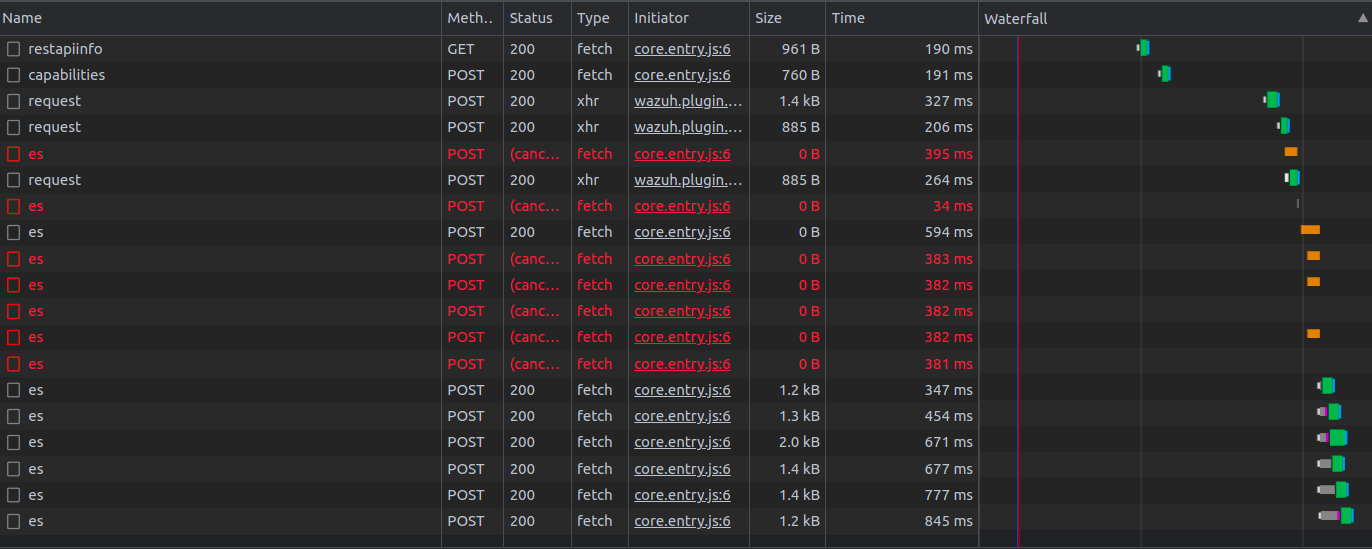
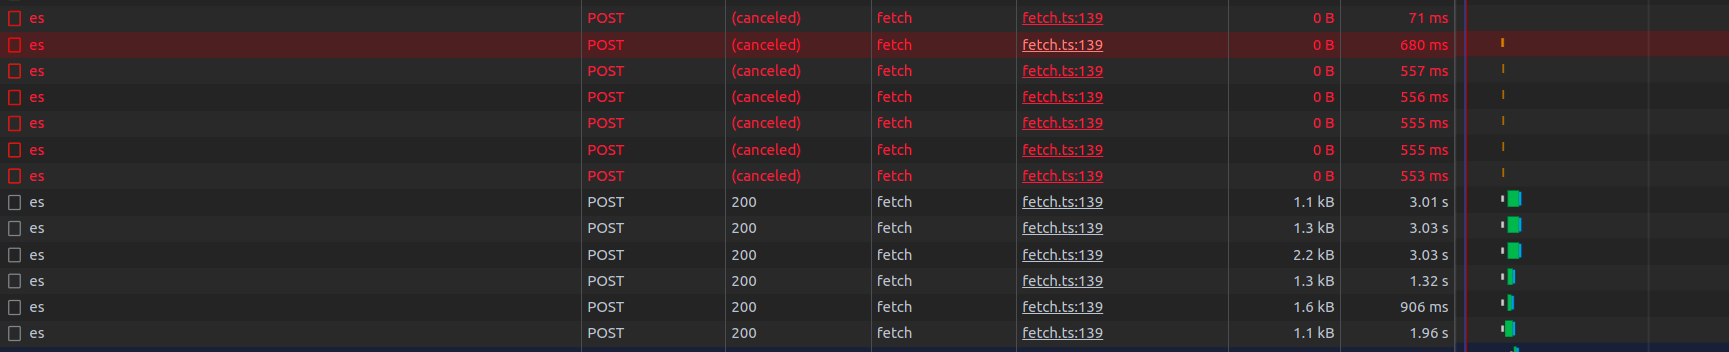
Description Whenever a dashboard initially loads it calls query requests twice. The first sequence is cancelled and the 2nd is fully loaded. The desired behavior is to avoid unnecessary requests.
Preconditions
- Have alerts
Steps to reproduce
- Load Security events dashboard
Screenshots If applicable, add screenshots to help explain your problem.
This behavior is not present in native dashboards
Analysis
After analyzing the redundant query calls we found out overview dashboard not only triggers the rendering of the visualizations with the vis-factory, but also depends on many features of Wazuh kibana-discover to handle some filter management, sub-tab changes to refresh the visualizations and other features. The full extent of the features dependency still needs further research, but regarding this issue it suggested to refactor the way visualizations are handled to avoid using kibana-discover integration to feed the visualizations. This has been requested before in this issue.
E.g. each sub-tab change triggers visualizations updates defined in kibana-discover integration https://github.com/wazuh/wazuh-kibana-app/blob/4.3-7.10/public/controllers/overview/overview.js#L234 https://github.com/wazuh/wazuh-kibana-app/blob/4.3-7.10/public/kibana-integrations/kibana-discover.js#L1110
Requests made to:
/internal/search/es
1st Stacktrace
| file | initiator |
|---|---|
| kibana-vis.js 150 | await this.visHandler.render |
| kibana-vis.js 320 | updateVis |
| kibana-vis.js 308 | ComponentDidUpdate |
| vis-factory-handler.js 77 | buildOverviewVisualizations |
| overview.js 169 | updateSelectedAgents |
| overview.js 283 | switchTab |
| overview.js 377 | Init |
| overview.js 79 | $ |
| get-ip.js 63 | buildSavedObjectsClient |
| get-ip 93 | getIp |
| routes.js 47 | ip |
2nd Stacktrace
| file | initiator |
|---|---|
| kibana-discover.js 213 | $fetchObservable.next() |
| discover_state.js 55 | set |
| discover_state.js 101 | setState |
| discover_state.js 72 | setAppState |
| kibana-discover.js 610 | $scope.handleRefresh |
| kibana-discover.js 1011 | const tabListener = $rootScope.$on('changeTabView' |
| overview.js 211 | switchSubtab |
| overview.js 287 | switchTab |
| overview.js 377 | init |
| overview.js 79 | $onInit |
| get-ip.js 63 | buildSavedObjectsClient |
| get-ip 93 | getIp |
| routes.js 47 | ip |
3rd Stacktrace
| file | initiator |
|---|---|
| kibana-discover.js 991 | $scope.loadFilters |
| common-data.js 232 | af |
| common-data.js 400 | assignFilters |
| vis-factory-handler.js 74 | buildOverviewVisualizations |
| overview.js 169 | updateSelectedAgents |
| overview.js 283 | switchTab |
| overview.js 377 | init |
| overview.js 79 | $onInit |
| get-ip.js 63 | buildSavedObjectsClient |
| get-ip 93 | getIp |
| routes.js 47 | ip |
This issue has been replicated in Wazuh 4.2.5 to validate it's not a byproduct of a 4.3 feature. It has been confirmed this behavior happens on older Wazuh versions, so it further supports the idea the issue has deep roots in the visualization management and a refactor is probably the best approach.
App version: 4.2.5 App revision: 4206-1