pywebio-chart-gallery
 pywebio-chart-gallery copied to clipboard
PyWebIO data visualization demos.
PyWebIO Chart Gallery
PyWebIO supports for data visualization with the third-party libraries.
This repo shows examples of data visualization using plotly, bokeh, pyecharts and cutcharts in PyWebIO
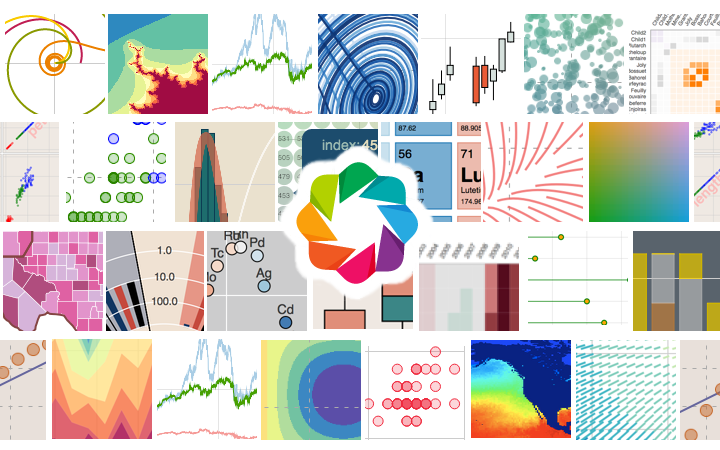
- bokeh: Use bokeh for data visualization. demos
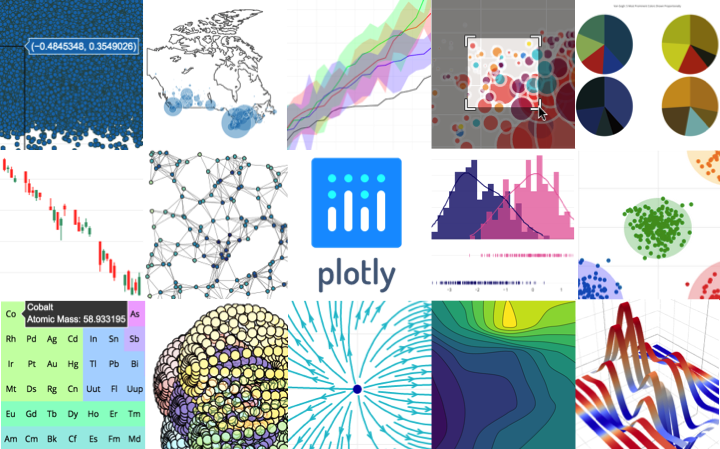
- plotly: Interactive, open-source, and browser-based graphing library. demos
- pyecharts: Create Echarts-based charts in Python. demos
- pyg2plot: Create G2Plot-based charts in Python. demos
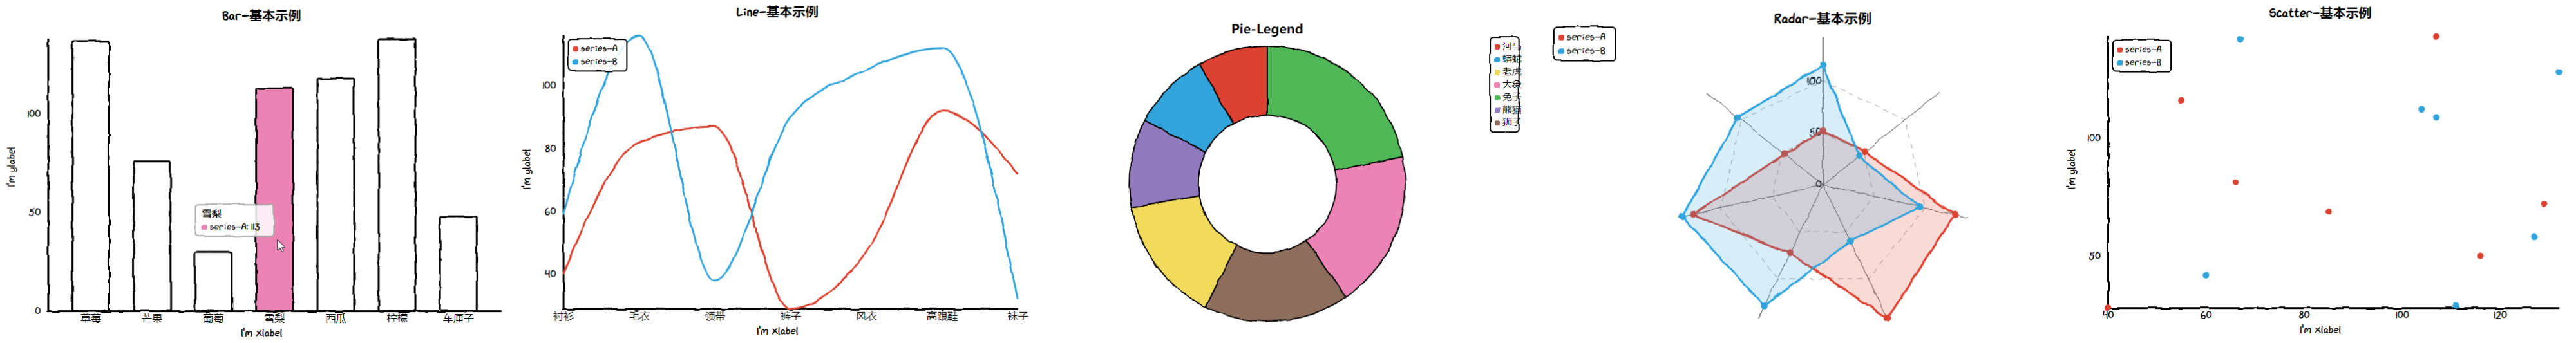
- cutecharts.py: Create a hand drawing style charts. demos
Charts Snapshot
Bokeh
Plotly
Pyecharts
Cutecharts.py
Run Demo
Start demo
python3 run.py
Rebuild demo
pip3 install -r requirements.txt -r requirements-dev.txt
git submodule update --init --recursive --depth=1
python3 pyecharts_demo/build_demos.py
python3 plotly_demo/build_demos.py
python3 bokeh_demo/build_demos.py