Feature request: min/max values for logged metrics
Thank you for developing such a useful service.
As a practitioner I care disproportionately about the peak metrics in any given run. I.e. max mAP50 for object detection (and min classification/localization losses) or peak mIoU for segmentation. I rarely, if ever, care what the metrics are at the last step of the training run, per se. Things begin to overfit by then anyway.
W&B doesn't seem to offer a way to derive such min/max in the experiments table, or indeed anywhere its UI as far as I can tell. It'd be great (and probably not too complicated) to add this feature.
Thanks!
Issue-Label Bot is automatically applying the label enhancement to this issue, with a confidence of 0.87. Please mark this comment with :thumbsup: or :thumbsdown: to give our bot feedback!
Links: app homepage, dashboard and code for this bot.
Hey @depthwise, thanks for the feature request. One thing you can do immediately is log a separate metric that only updates when your metric increases or decreases, i.e. "min_loss". What framework are you currently using?
Yes, this feature would be very helpful! The parallel coordinate and parameter importance plots do not make much sense if "best" values are not used to generate them. So, it would be nice to have or be able to generate simple derived metrics like min, mean, max, etc.
@vanpelt is there a plan to add this to the UI? Like I previously said, this would be extremely helpful and make parallel coordinate and importance plots more meaningful
Hey @ayushjaiswal we have plans for derived metrics but I want to make sure we understand your use case as it relates to parallel coordinates or importance. Could you link us to an example workspace and describe how you would want it to work specifically?
Again, in the meantime you can update the summary of a run to achieve this today: https://docs.wandb.com/library/api/examples#update-metrics-for-a-run-after-run-finished
@vanpelt typically, (hyper-)parameter importance is judged by how the parameter affects the best score (such as validation loss/accuracy in classification) achieved by a trained model. Currently, the parameter importance is calculated using the last logged score instead of the best achieved score.
Similarly, for example, if I wish to plot parallel coordinates with three axes (left to right) -- learning_rate, validation_loss, validation_accuracy, I would be interested in plotting the best validation_loss and validation_accuracy to study the interplay between these and the learning_rate. Plotting the last logged values of these metrics alongside learning_rate does not provide any meaningful information.
Hope this helps understand the use-cases better. Thanks!
Hey Guys, sorry for not responding to this sooner. The simplest way to address this today is to log a metric that only gets updated if it improves, i.e.:
best_acc = 0
for e in range(epochs):
    acc = eval(...)
    best_acc = max(acc, best_acc)
    wandb.log({"best_acc": best_acc, "acc": acc})
We still have plans to add computed metrics in a future release, this would enable you to define new metrics using expressions like this after the fact.
This issue is stale because it has been open 60 days with no activity.
I am a little confused with the thread
The initial ticket was raised for a lack of feature that could help us with finding the min or max of an experiment from the UI.
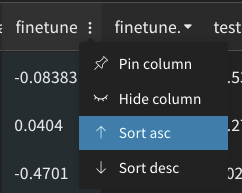
We indeed have a solution of sorting the table in an ascending or descending order of any chosen metric from the UI.
In the later parts of the thread, I am seeing feature requests for conditional logging where we would log only if the metrics increase or decrease.
Do you guys feel that there should be two individual issues for this? And this thread could be closed in relation to the initial ticket raised?
Metrics don't always improve, and columns show the last value, not the best one (AKA the only one the researcher actually cares about). The request is to display (and be able to sort by) the min or max value in the time series.
Just want to point out that, although the logging solution proposed by @vanpelt works for future runs, it doesn't address what we should do for runs that have already finished. There are many of us with a lot of runs that we'd like to apply this on retroactively.
I also think this feature would be very useful. Are there any temporary solutions for this, other than manually coding in and logging a metric that holds the max/min value of a run?
Still not available? A derived metrics features would be extremely useful. Or at least being able to apply basic min/max/avg to a run's logged metric values, rather than just min/max/avg across runs' summary values
@mmwebster totally agree. We're hard at work on a new system that will eventually support this and there are some exciting possibilities it will unlock. Unfortunately we don't currently have a timeline for exposing this in the experiments table but we'll update this ticket when we do.
I'll also add that we've introduced a new metric api that makes this easy for future runs: https://docs.wandb.ai/ref/python/run#define_metric
For instance you could call run.define_metric("acc", summary="max") and this will automatically store both the latest and the max value in the summary for filtering.
@vanpelt Fantastic, looking forward to it! And thanks for mentioning define_metric(), that's actually really useful
I've encountered this recently with my own runs. To address it, I've put together a script that updates target metrics of previous runs with best values as reported by api.run.scan_history(). Here it is.
~~Use the first revision if you don't like tqdm loading bars.~~
I feel like I should have read this issue before starting a long sweep 😅 can't wait to see this feature implemented!
I've encountered this recently with my own runs. To address it, I've put together a script that updates target metrics of previous runs with best values as reported by api.run.scan_history(). Here it is.
~Use the first revision if you don't like tqdm loading bars.~
Thanks for the script @LTeder, it came in really handy! BTW, I think you have the conditions reversed in
            if (  (func == max and bests[i] < previous[i]) or
                  (func == min and bests[i] > previous[i])):
Shouldn't it be:
            if (  (func == max and bests[i] > previous[i]) or
                  (func == min and bests[i] < previous[i])):
Thanks for the script @LTeder, it came in really handy! BTW, I think you have the conditions reversed
Glad you found it useful @ndrwnaguib ! It looks backwards there because the point is to print the "bad" changes during the test run. It counts and displays the value changes that wouldn't be applied (given the if-statement that follows it), but are still important to recognize. In my case, they all appeared to be rounding errors (which was about 2% of my runs, iirc)
I think this feature is finally available, with weave expressions!
To create a barplot with the lowest validation loss for each run, I chained an expression together like this:
runs.map((row) => row.history["val/loss"].min)
@vanpelt's define_metric solution works perfectly for new runs - thank you! However, I agree it would be extremely useful to be able to obtain the min and max values of the logged metrics within the UI for past runs.
@vanpelt's
define_metricsolution works perfectly for new runs - thank you! However, I agree it would be extremely useful to be able to obtain theminandmaxvalues of the logged metrics within the UI for past runs.
Agreed, whether is it via weave expressions or define_metric, it is not directly obvious to new users. It would probably be for the best if one can easily view the min max values from the UI with no additional code added before running.
WandB Internal User commented: SteffenCzolbe commented: I think this feature is finally available, with weave expressions!
I chained an expression together like this:
runs.map((row) => row.history["val/loss"].min)
This creates a barplot with the lowest validation loss for each run.