[App, Urgent]: Missing chart datapoints
Current Behavior
Wandb is prunning data points from graphs, I guess to save memory and improve performance.
Unfortunately, this seems to happen also for Validation charts, where the number of points is very small (eg 1 point every 50k steps) and this leads to missing validation datapoints. Refreshing the page seems to show different data points in the chart.
This is a super serious issue - this prevents people from viewing the validation results reliably!
Expected Behavior
For sparse graphs, no pruning happens and all data points are shown reliably. Eg, do not prune below 100 data points in the chart.
Steps To Reproduce
No response
Screenshots
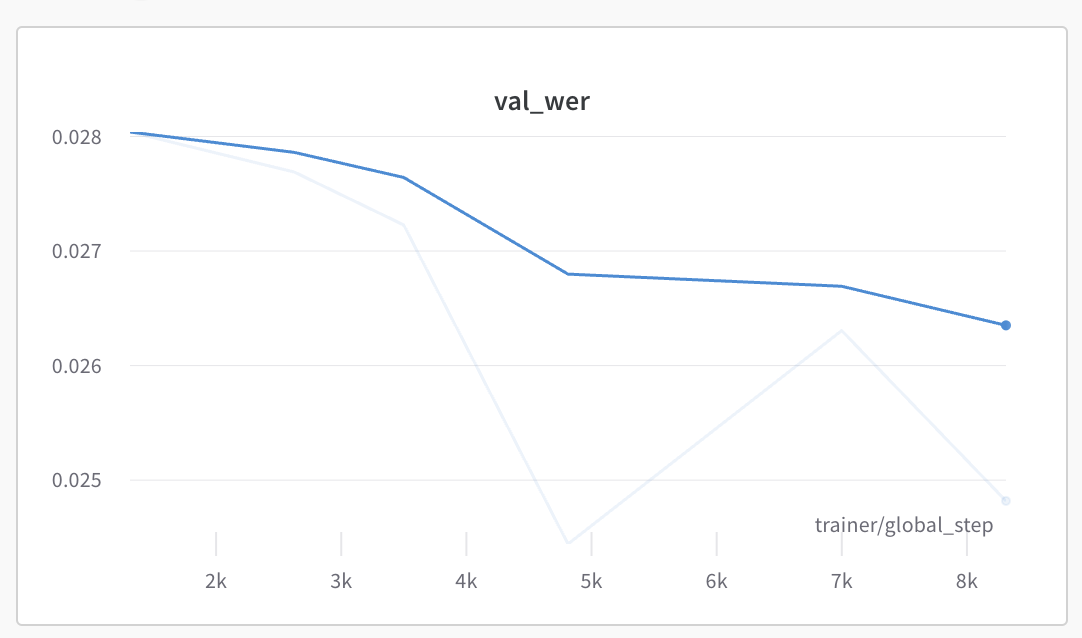
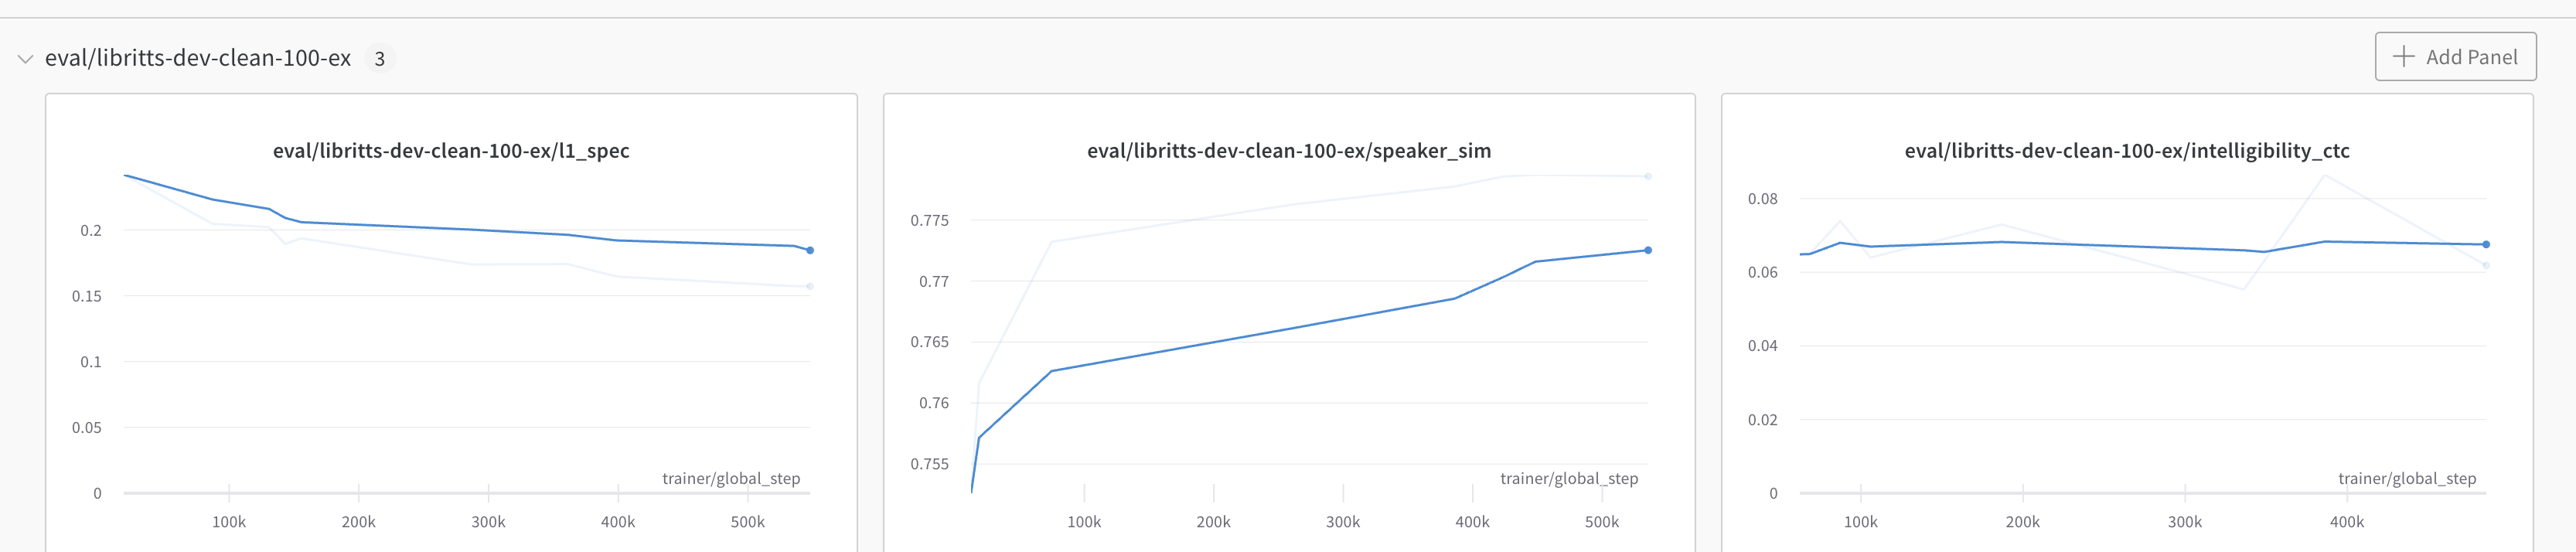
Notice 3 data points being shown:
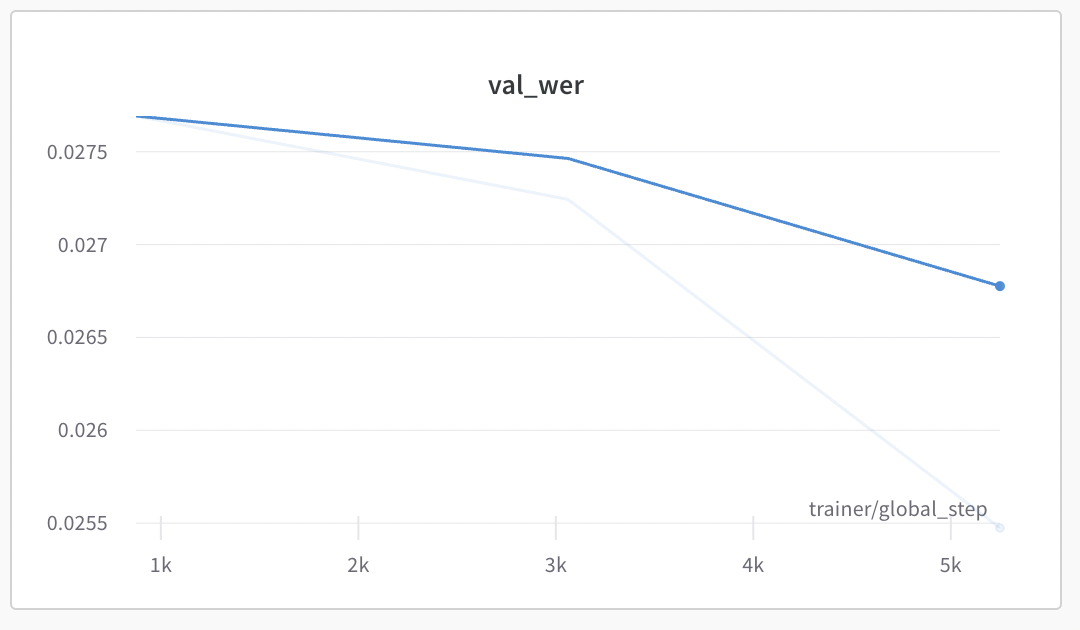
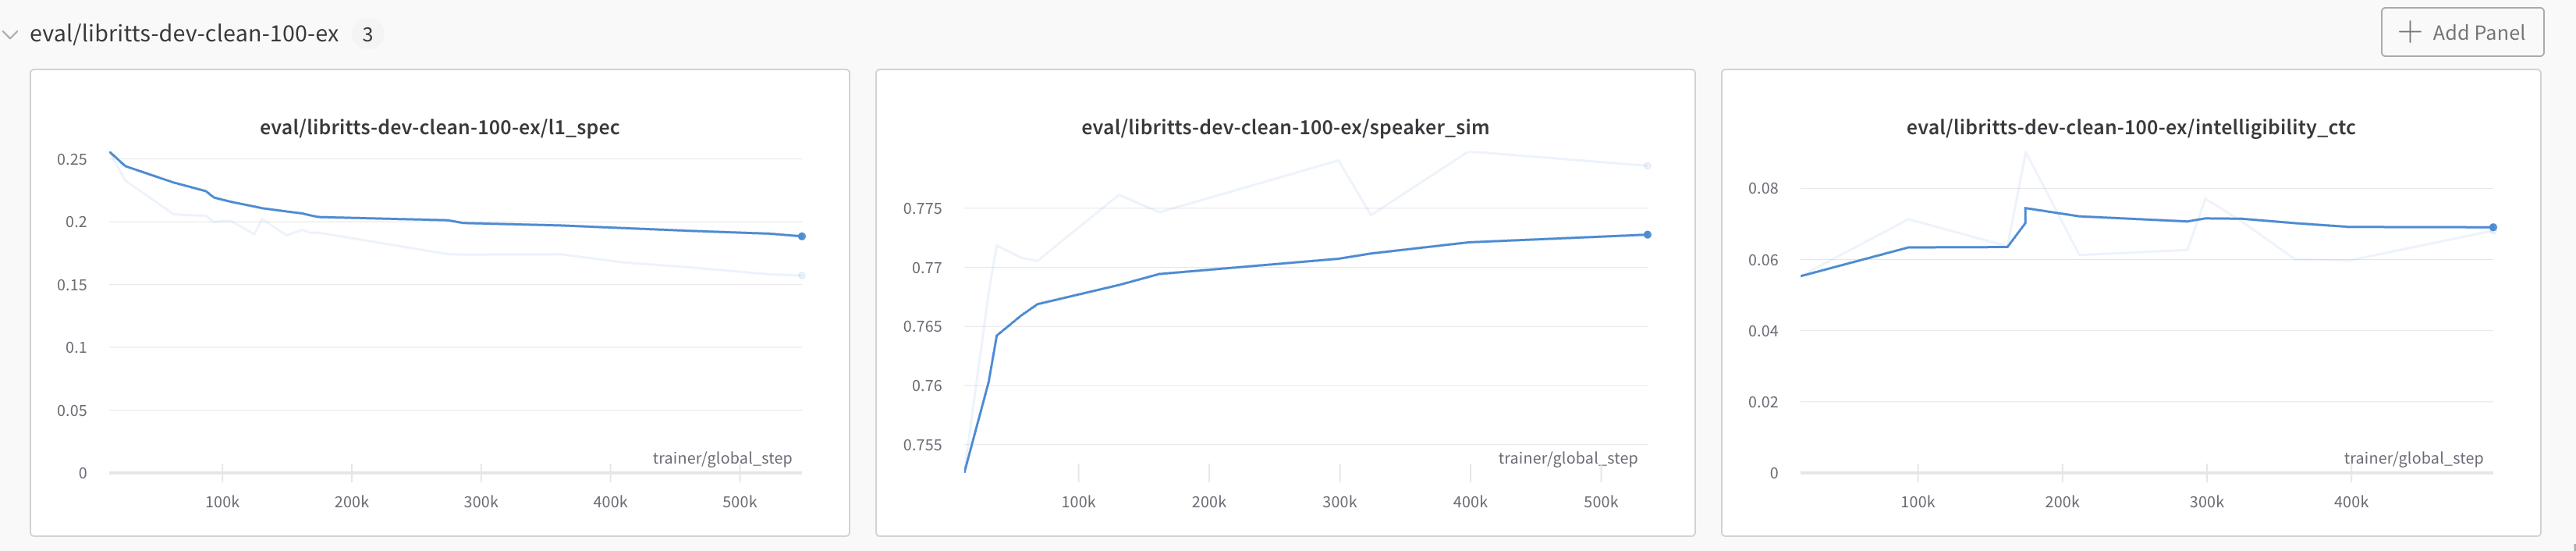
Refresh page, more datapoints being shown:
Environment
OS: MacOS 12.5
Browsers: Chrome 104
Additional Context
No response
Same issue on Chrome on MacOS. Started happening since yesterday, though I did see this before a few months ago.
It seems a bit random which points are shown, I'm getting different sized gaps between data points, which makes me think this is more likely a bug than a performance feature?
Same in here, I'm wondering whether you guys are working on it or not.
In my case, the metric just entirely disappears, and it slows down my progress.
Hey @PiotrDabkowski @yyliu01 @TJKlein @AlbertoPresta @geoffsmith,
Thanks so much for reporting this issue with plots not showing correctly in the UI, sincere apologies for the inconvenience. We have looked at this as a matter of urgency and should have now fixed the underlying issue.
Please let us know if issues showing plots in the UI persist.
Best wishes W&B team,
Hey @PiotrDabkowski,
We wanted to follow up with you regarding plots loading in the UI to check that this has now been resolved on your end. Please let us know if we can be of further assistance or if your issue has been resolved.
It seems to be fixed now, will reopen if I see it happening again. Thanks!
WandB Internal User commented: PiotrDabkowski commented: It seems to be fixed now, will reopen if I see it happening again. Thanks!
Hi @PiotrDabkowski, Thanks so much for updating us. Would you be able to try clearing your browser cash/ refreshing the page of old runs? Look forward to hearing back from you and if this does not work then we can investigate further and would be great if you could email [email protected] with a URL to your workspace and we can dig a little deeper.
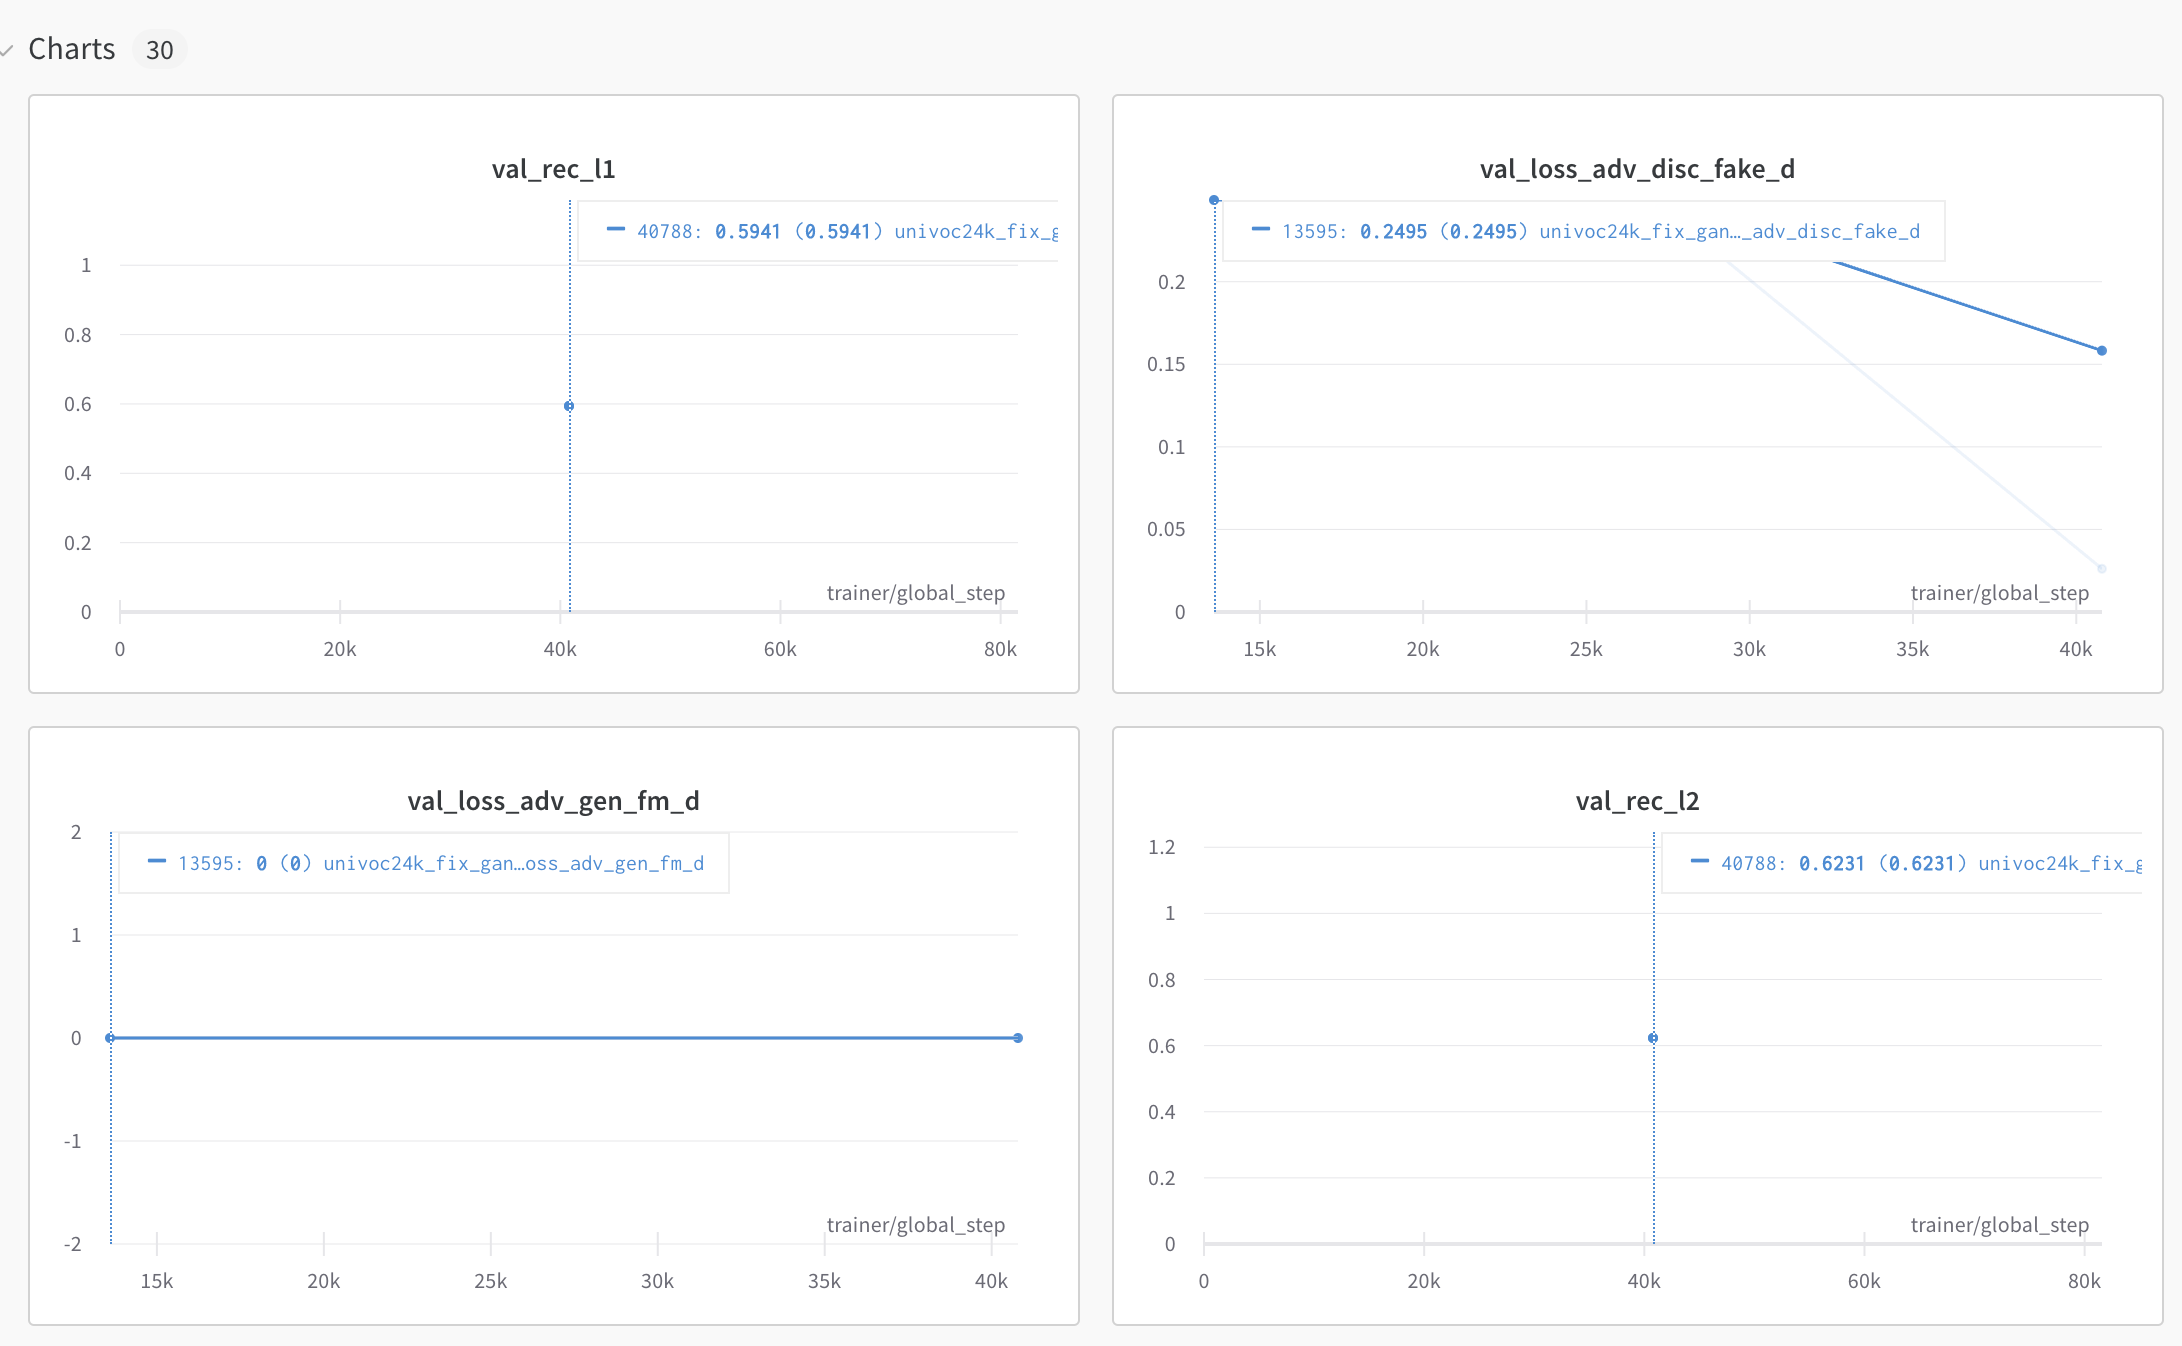
Actually it is still a bit flaky (even for current runs) and some datapoints are missing in val charts. Eg here missing penultimate datapoint (no point at ~40k):
I did clear the cache etc.
After reloading a step at ~15k is missing and the one at 40k appeared:

Hey @PiotrDabkowski , Thanks so much for messaging us back and highlighting this.
I can see that you might have been experiencing two separate issues:
Missing data points last week was a more pervasive issue affecting plots more visibly (a large number of data points missing across many plots).
Changes in how the same data points are showing on the same plot.
Summarizing for clarity 😄 .
We looked into the second issue late yesterday again as a matter of high priority and this should also now have been fixed for you. I have had a look at plots that are very similar to your own throughout the day and they appear stable and consistent now. Please let us know if this has now been fixed for you and if your plots are constantly showing thanks again for surfacing this.
Hey @PiotrDabkowski,
Checking in if your plots are now showing as expected on your end or if you need any further help here.
Thanks, it was fine, but now the problem started to appear again:
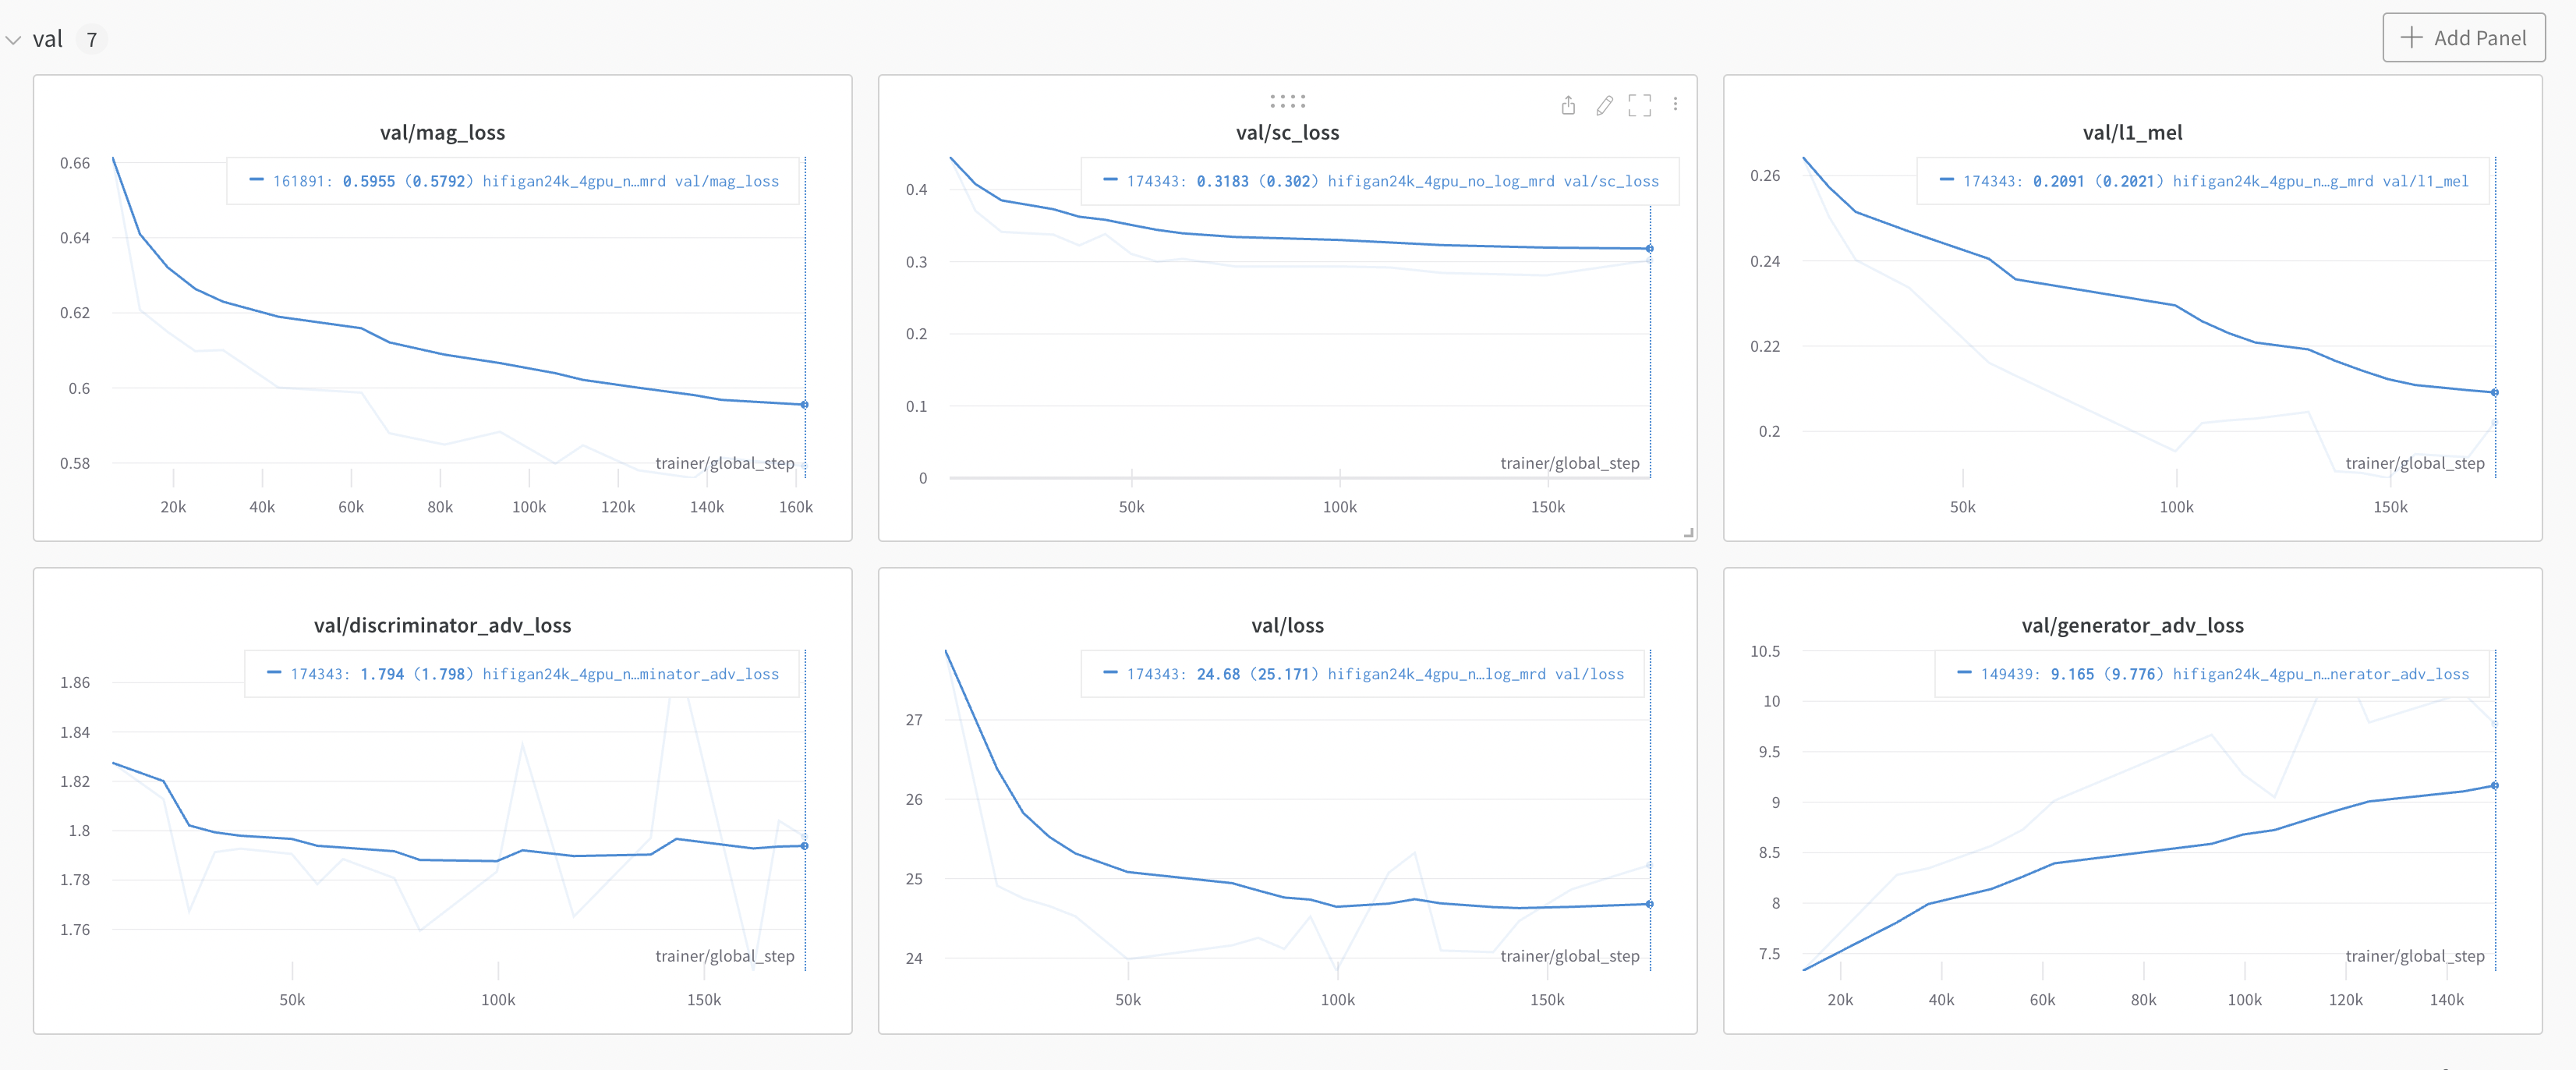
Notice the validation charts each has a different number of steps - it should be the same for every chart.
Hi @PiotrDabkowski ,
Thanks so much for messaging in with this. Your previous issues after analysis were a result of down-sampling data, this has been adjusted to meet the needs of your use case. You are correct that the number of steps should be the same for each chart and I can see from the screenshot that the bottom right plot val/generator_adv_loss appears to be missing the 160k step.
If you are viewing charts during training it is possible that this data has not yet been logged and or uploaded to WandB if your run is still logging training data. In order to get to the root cause of what you are experiencing, would be able to confirm if this is the case for runs that have successfully finished and/or whether this is something that was transient during the training of runs?
Look forward to hearing back from you.
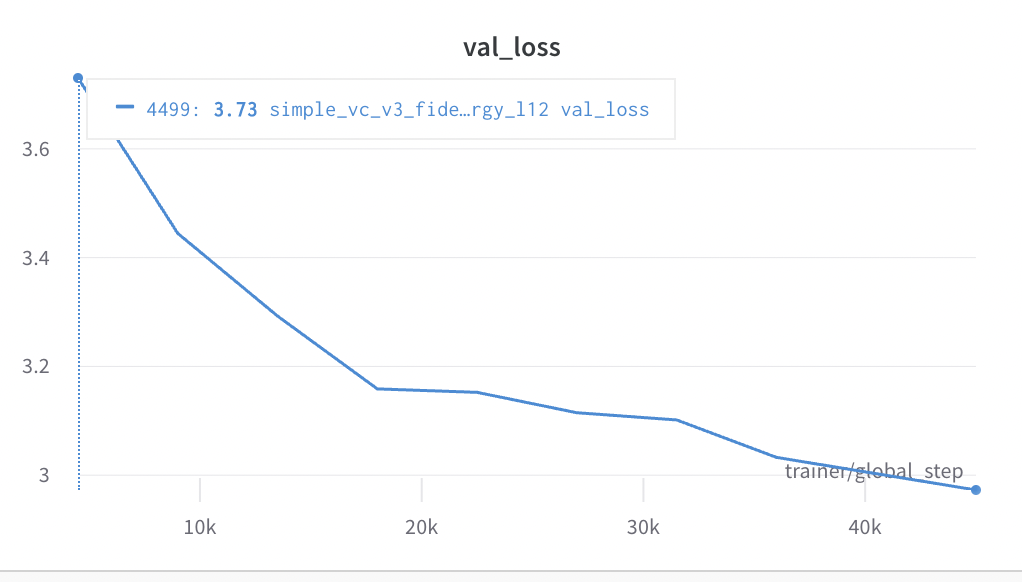
Thanks, the results in the graph change every time I refresh the page, and some points are missing on one refresh and present on another:
So the results are uploaded and present on the wandb side, but the client does not get all the datapoints and in fact gets a different set of datapoints with every refresh. So it is like when the bug was first reported, even though it was fixed for some time (or at least I did not see any issues).
Hey @PiotrDabkowski , Thanks for messaging and so sorry that I can see this clearly in your screengrabs are different, and how we sample data should not I believe affect you in this way.
I am going to highlight this to our engineering team for you again. One aspect that would be really helpful here in investigating this and pinning down what you are experiencing in the UI, would be if you'd be able to share two screenshots that included the run name either here or email this to [email protected] (if this is sensitive) after two consecutive refreshes.
Look forward to hearing back from you and getting to the bottom of this.
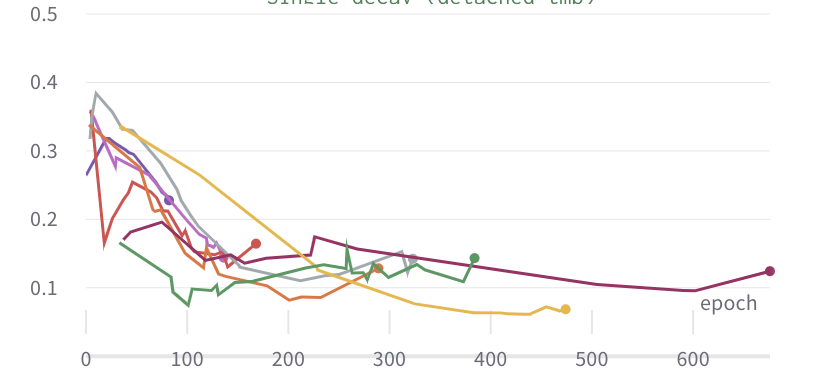
Thank you @fdsig, sending screenshots (I turned off smoothing to make it clearer):
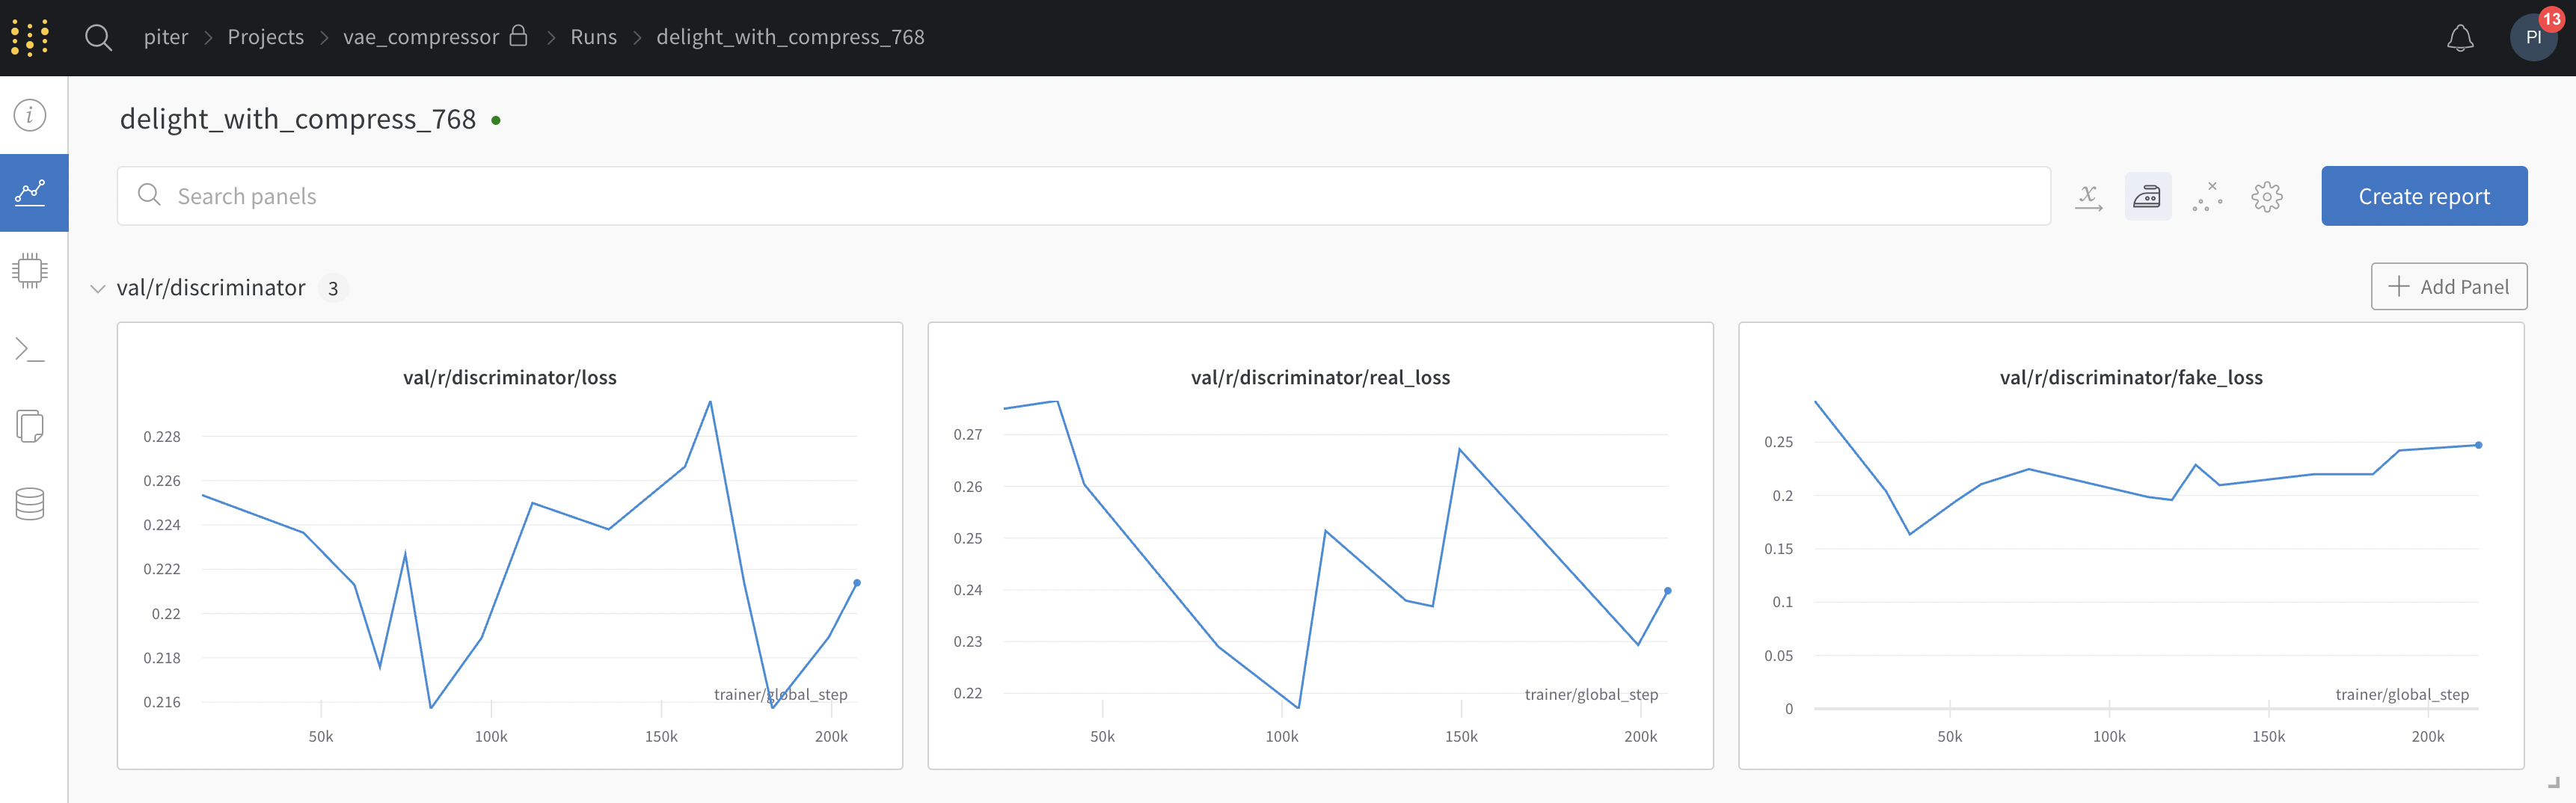
after refresh:
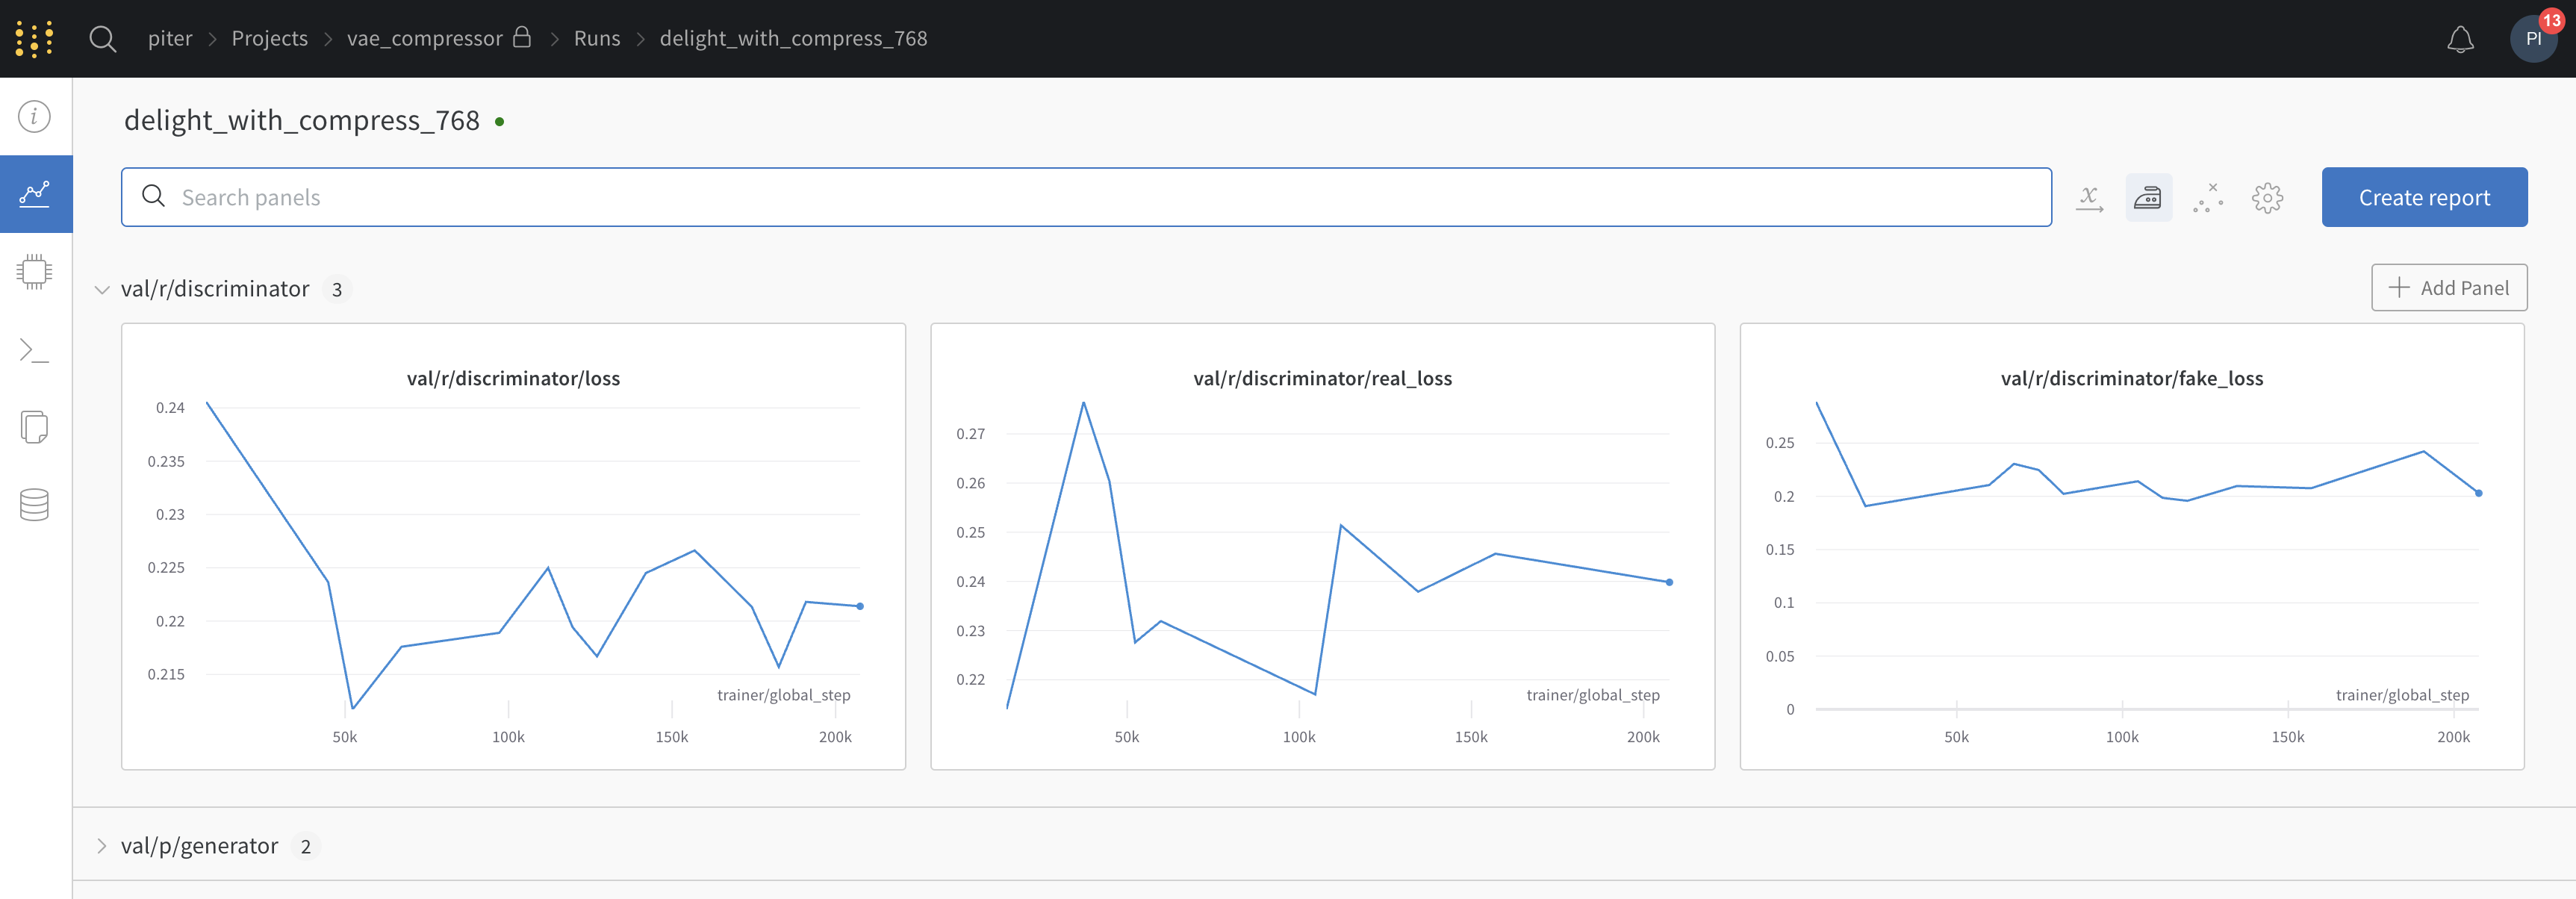
The charts change after refresh because some points start to appear, and some disappear.
WandB Internal User commented: PiotrDabkowski commented: Thank you @fdsig, sending screenshots (I turned off smoothing to make it clearer):
after refresh:
Hi @PiotrDabkowski , thanks again for taking the time to highlight this and for sharing the run. We do sample data and it appears that the need to sample alongside a combination of a large number of global steps (data points) and a small plot window is creating the behavior that you are observing. I have also been able to reproduce this behavior and While I have been advised that this is anticipated behavior I can see that this is quite a server for you and will highlight how this is impacting on your particular used case to the engineering team.
To make the effect (variance in your plots less visible when refreshing ) I wonder if you would be able to expand the chart sections by clicking on a corner of a plot and dragging as this results in a more consistent plot. This should minimize the effects that you are seeing.
In order to create a plot without sampling you would need to retrieve unsampled data via our public API further details on this can be found here:
import wandb
api = wandb.Api()

run = api.run("<entity>/<project>/<run_id>")
history = run.scan_history()
losses = [row["loss"] for row in history]
In terms of addressing how plots behave for your use case in the UI I am wondering if a feature request to take the mean of repeated samples, or to plot mean and variance would give you the insights that you are looking for? If so I can submit a feature request for this for you.
Thanks a lot @fdsig for understanding.
I see from the implementation perspective why it happens, and that it is easier to implement it this way - to simply sample a certain fraction of global staps. This strategy works well for training charts.
The main problem is that the validation chart does not have many points - it is actually just ~20 points and removing any of them will end up confusing users. Especially if you remove last points, the user will not have up to date/final validation metrics.
I am sure you agree that this is far from perfect and likely you do not want your users to experience this - eg lack of last validation point can can result in incorrect value being reported in the research paper.
I am sure your engineering team can make sampling more robust, the implementation is a bit harder (eg some smart, deterministic sampling, dependend on number of points in the chart, not dropping first/last points), but I think it is worth it, especially that you have so many users that really care about validation metrics :)
Hey @PiotrDabkowski ,
Thanks so much for sharing your insights and thoughts here! I will certainly convey the needs of your used case to our eng team.
Let me know if there is anything else that I can help with just now.
Hey @PiotrDabkowski ,
I wanted to provide an update here and advise that we have explored this further/ continue to strive to meet use cases like yours ( a large number of steps with smaller charts and potential higher variance/variability of data being plotted).
I have created two requests for you from what you have described:
- Enhance our docs to fully outline our sampling strategy & process in our documentation;
- A feature request that we allow users to customize some aspects of sampling where there is a tradeoff between l speed of loading in our UI and chart stability.
I know that this has been touched on above, however, I have noticed consistently that the following step help:
- Waiting for runs to finish (they can be unstable if sampling a large number of points with high variance and new data is still being added).
- Refreshing browser/clearing history after runs are finished.
While the above should cover the majority of cases and stabilize plots we would always welcome any issues with our chart rendering being highlighted,
Thanks again for your ongoing time and effort in explicating what you are experiencing and please surface any new issues that you face whether in relation to this thread on otherwise.
Thanks a lot @fdsig, that should help in the short term. I am using wandb daily and having accurate "small charts" that "just work" would be great! Indeed the issue is most visible in runs with 200k+ steps.
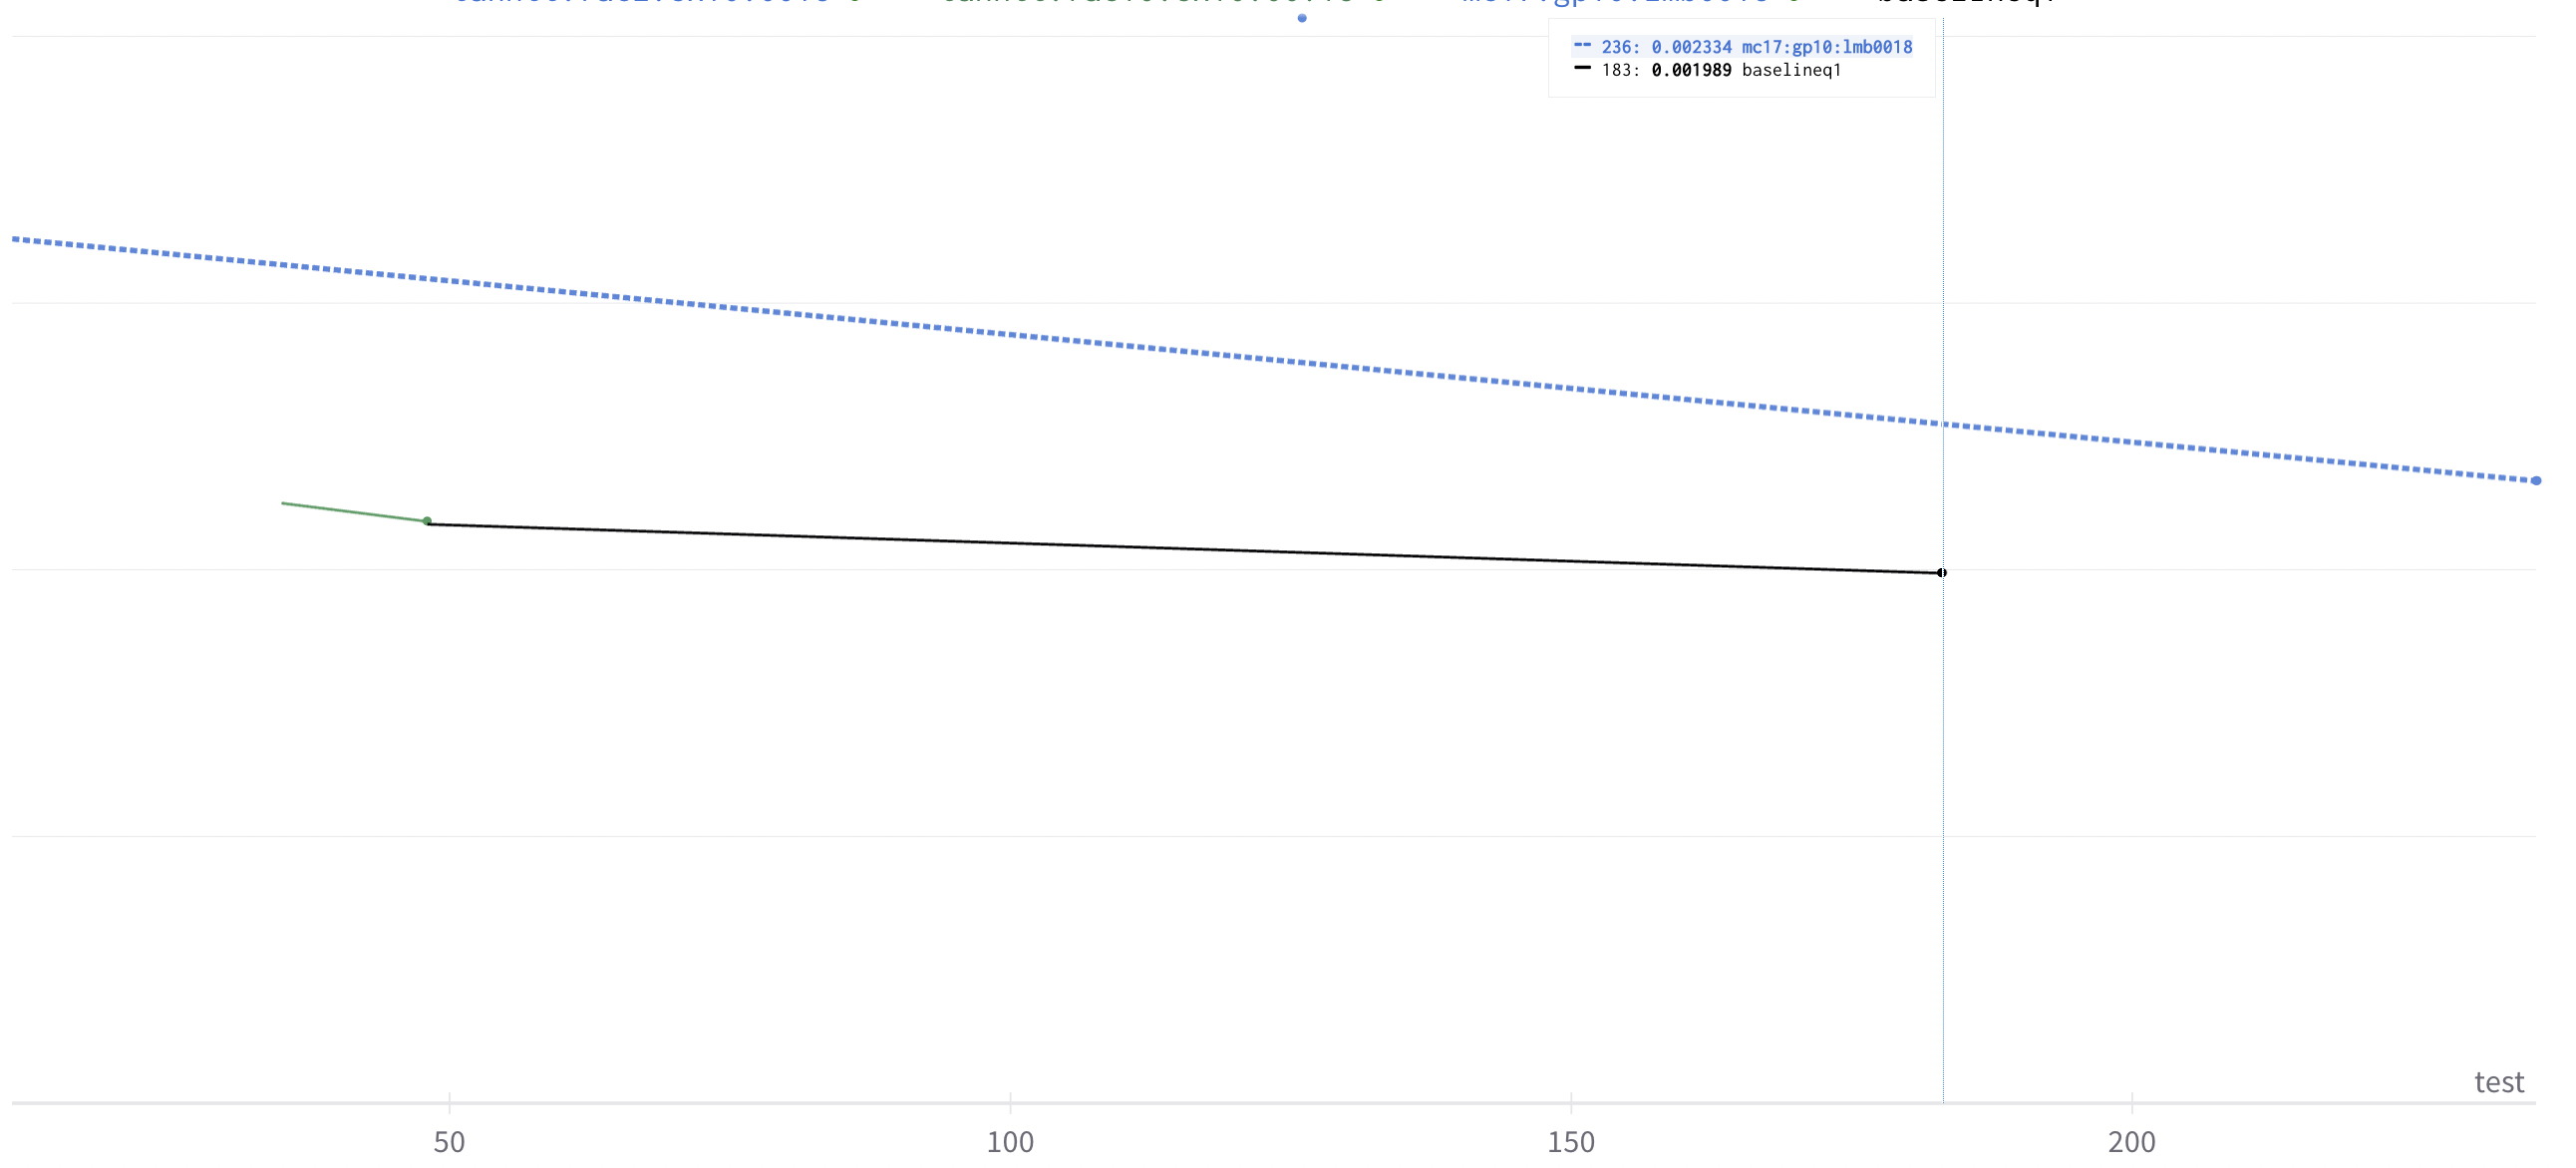
When can we get a customized sampling feature? @fdsig sir?
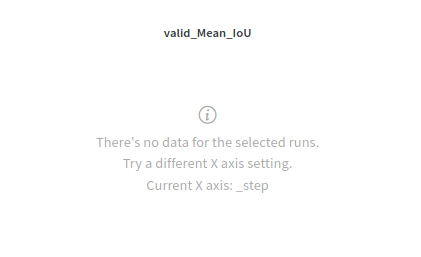
This is very frustrating especially when I get this: