webrtc-stats
 webrtc-stats copied to clipboard
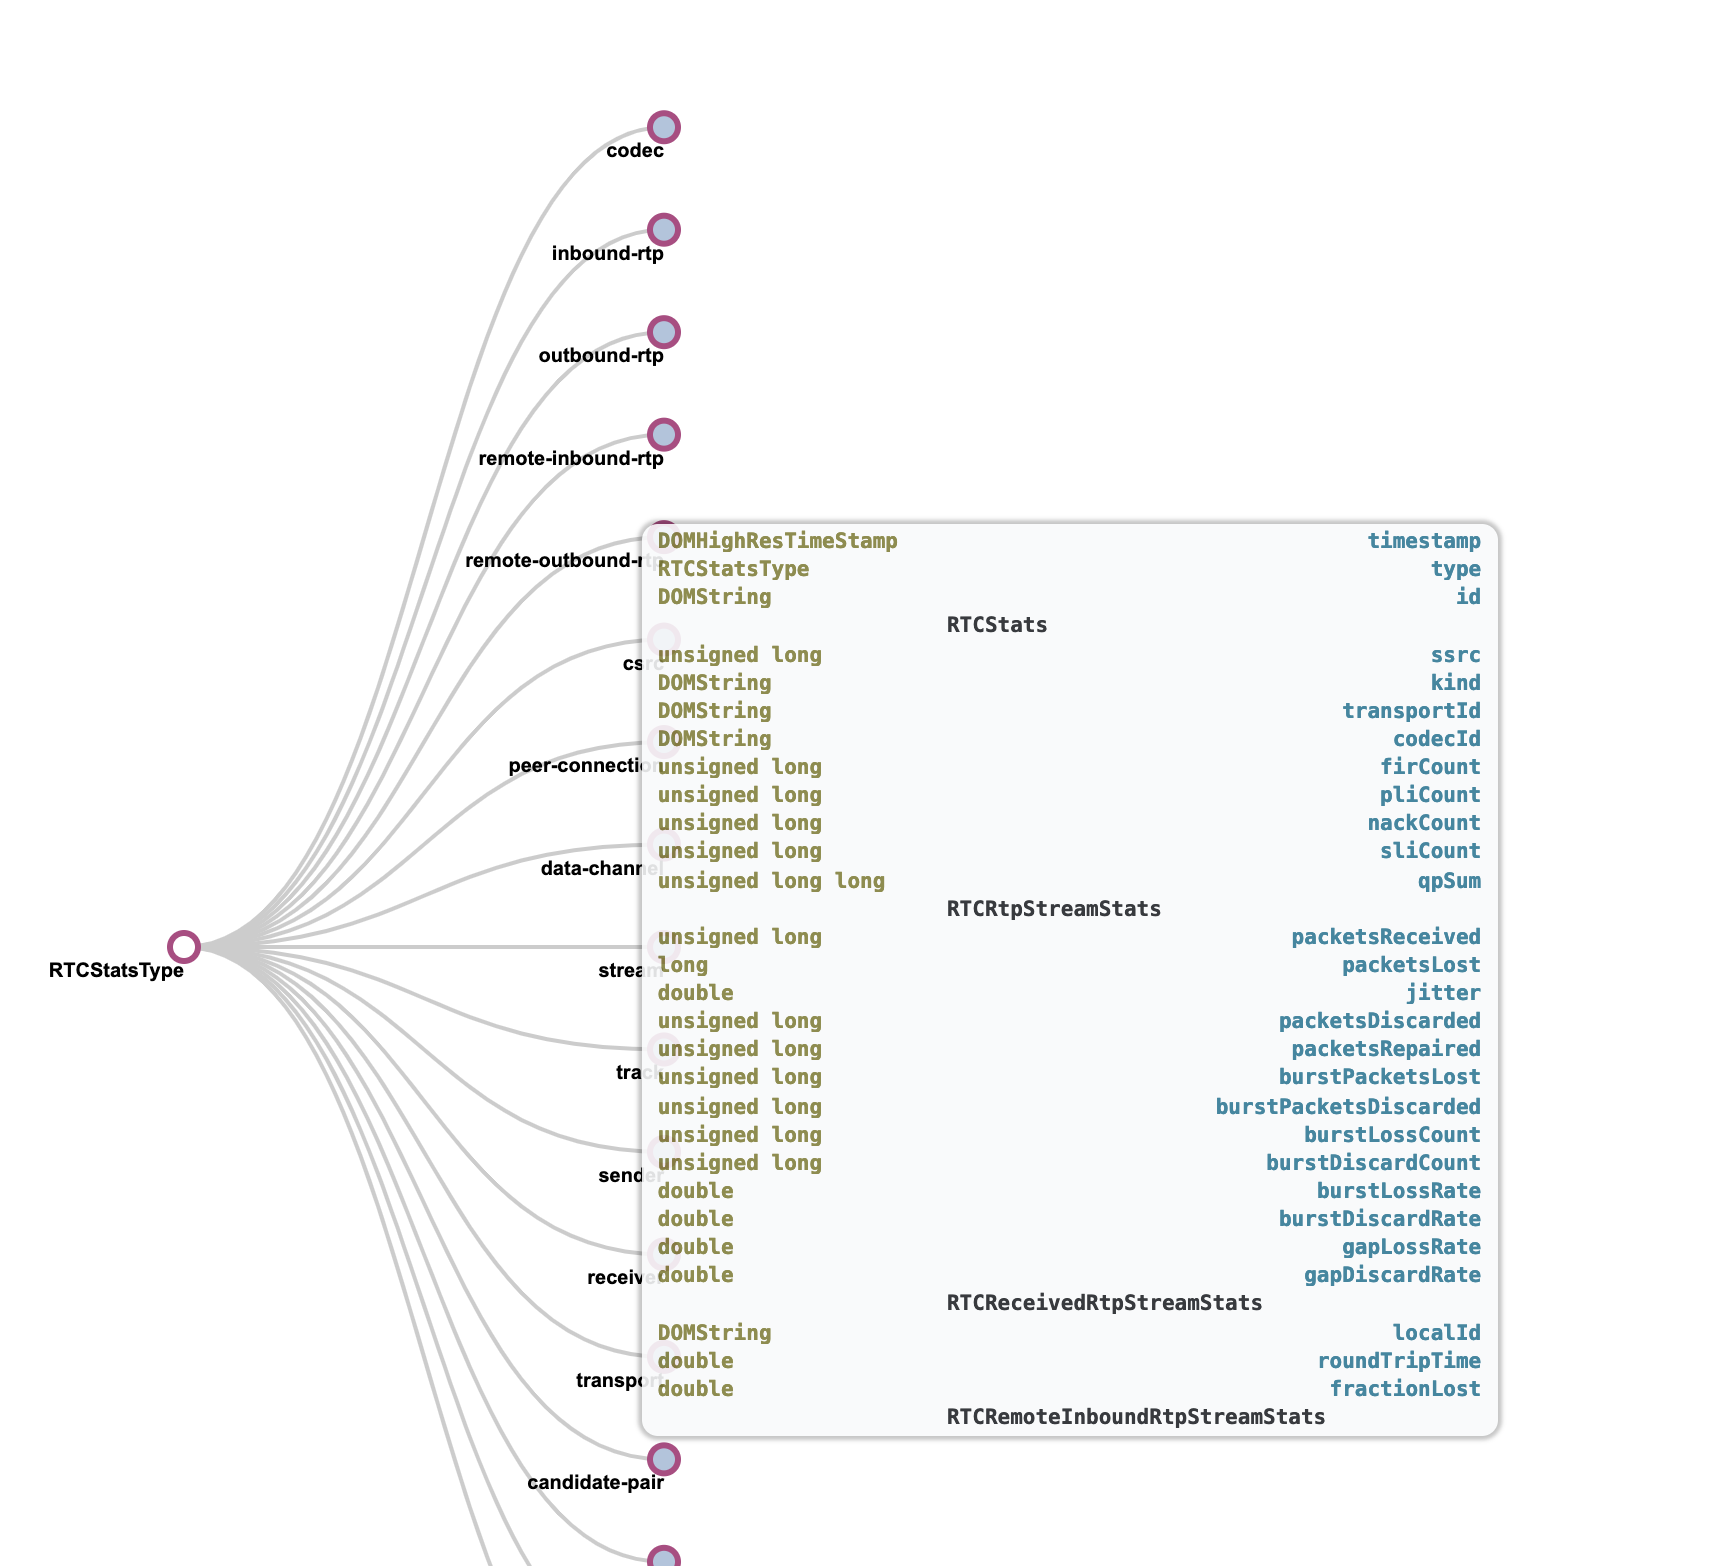
add a graph showing the relationship of stats to the spec
@henbos has done a whiteboard drawing of the current stats graph which I find very useful: https://photos.app.goo.gl/6P0i4AV1E3szctTl1
Would be great to add this to the spec too as it explains some of the concepts much better than two pages of text could
Here's a version of the picture linked above that doesn't have black lines indicating what is directly or indirectly referenced from the RTP streams: https://photos.app.goo.gl/7n0eresV2OvBNdAT2
The graphs shown in #350 sound like a more maintainable approach than hand-drawing them.
@balazskreith is taking responsibility for this.
When it is ready, we will need someone from W3C to vet the licenses on the dependency libs
There's also this slide from March 2017, though some of the dictionary names have changed since (click the map link for my brain dump at the time).
@pallab-gain and @karthikbr82 put together an interactive graph: https://webrtc-stats.callstats.io/graph/
@henbos @alvestrand @jan-ivar comments and feedback appreceiated.
Just in case, someone is interested: I created such a graph for my thesis as well, including differences between Firefox (version 77) and Chrome (version 84). Only stats relevant for audio/video communication are shown.

@MoeRT09 Thanks for producing this. This is good stuff.
For this issue, What we need for the spec should show the interlinking of the objects.