elasticsearch-prometheus-exporter
 elasticsearch-prometheus-exporter copied to clipboard
Incorrect es_os_cpu_percent after upgrade to 7.9.1
We've just upgraded elasticsearch cluster and plugin to 7.9.1 and I've noticed that es_os_cpu_percent isn't correct anymore.
Both top tool and GKE report the same CPU usage (less than 10%) while the plugin exports unusually high CPU usage (~40%).
I don't know if that's related, but during upgrading ES cluster (we are using ECK) node names remained unchanged, but node IDs did change.
 Elasticsearch built-in self-monitoring also reports correct CPU usage.
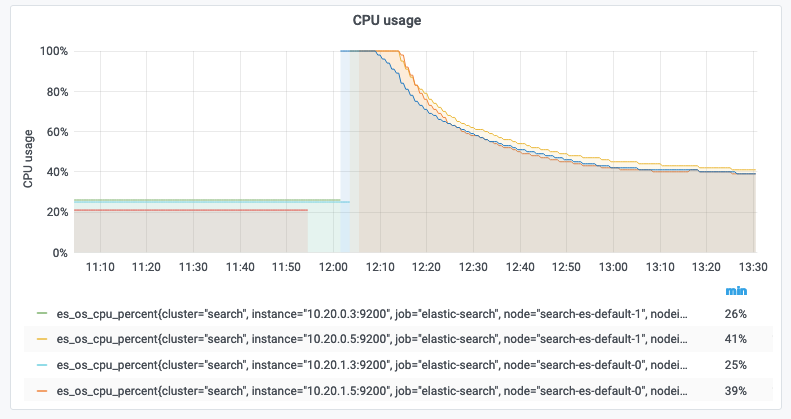
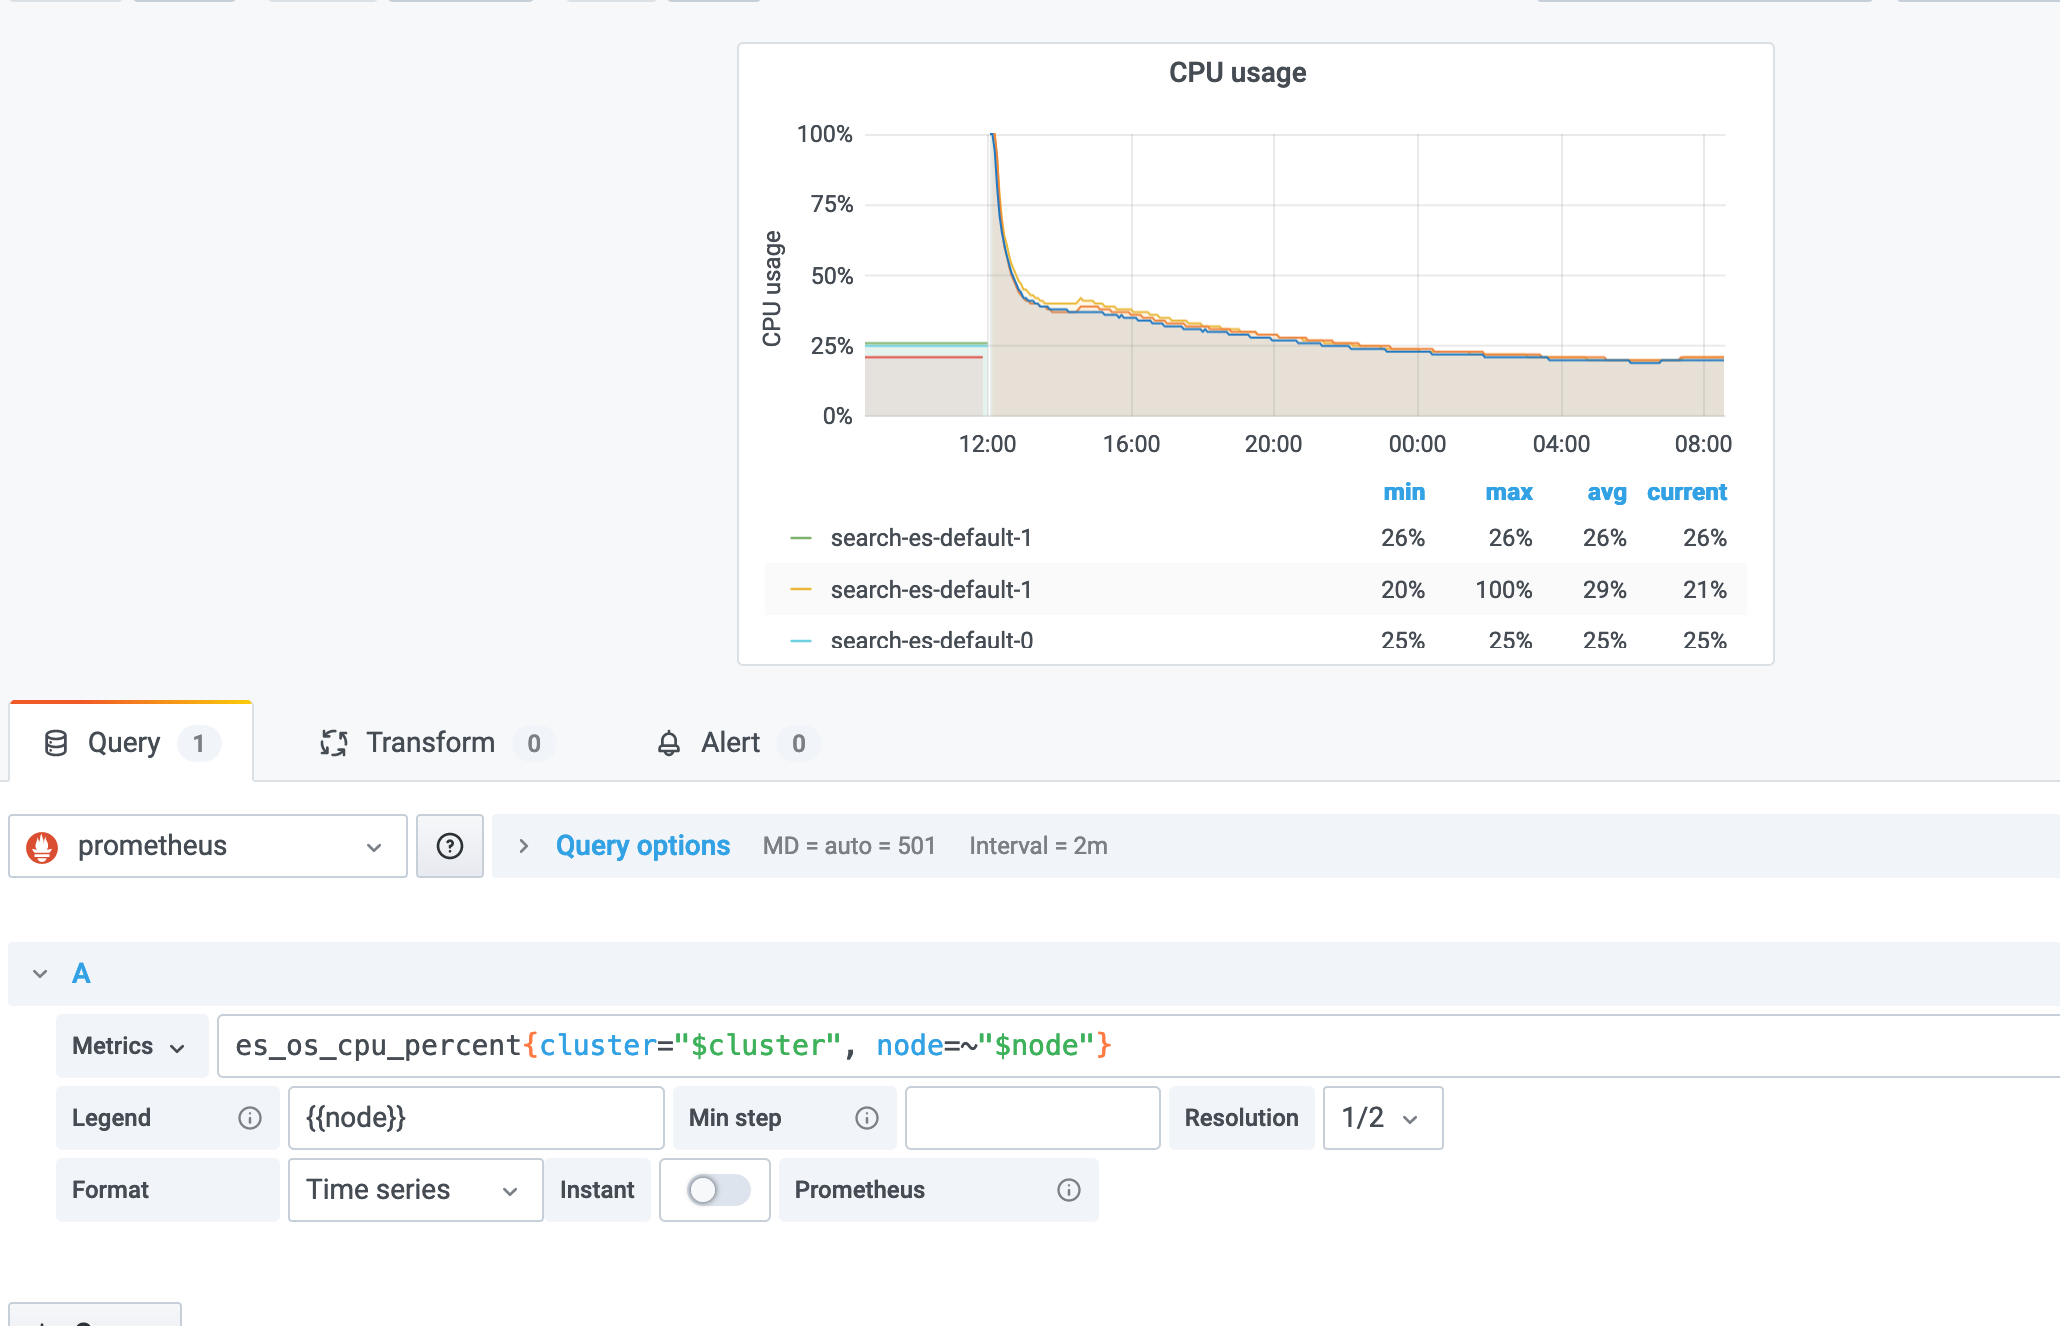
@dobegor What formula is used to pull the data for the chart from Prometheus in the first chart?
@lukas-vlcek the default one provided by @vvanholl's dashboard.
es_os_cpu_percent{cluster="$cluster", node=~"$node"}
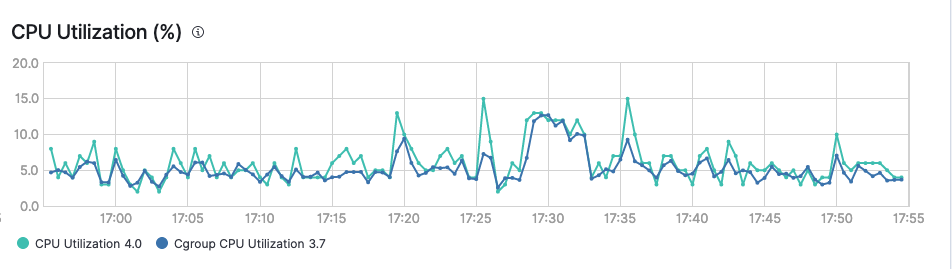
 GKE metrics:

I have similar issue, using 7.8.0.0 with elasticsearch 7.8.0. es_os_cpu_percent on all data node is always on 100. But I check the node is only using around 35%. And es_process_cpu_percent also showing around 35%.
Actually, I am getting it now too ...
I am getting:
$ GET "_nodes/stats?pretty&filter_path=nodes.*.os"
{
  "nodes" : {
    "rX711hApTOuSsXNMkwW8sQ" : {
      "os" : {
        "timestamp" : 1607710069891,
        "cpu" : {
          "percent" : 100,
          "load_average" : {
            "1m" : 4.84,
            "5m" : 5.01,
            "15m" : 7.99
          }
        },
        "mem" : {
          "total_in_bytes" : 51539607552,
          "free_in_bytes" : 23476277248,
          "used_in_bytes" : 28063330304,
          "free_percent" : 46,
          "used_percent" : 54
        },
        "swap" : {
          "total_in_bytes" : 0,
          "free_in_bytes" : 0,
          "used_in_bytes" : 0
        }
      }
    },
    "VMHGhhkMSQaf2PfxnICtoA" : {
      "os" : {
        "timestamp" : 1607710069903,
        "cpu" : {
          "percent" : 100,
          "load_average" : {
            "1m" : 4.57,
            "5m" : 3.89,
            "15m" : 4.64
          }
        },
        "mem" : {
          "total_in_bytes" : 51539607552,
          "free_in_bytes" : 19901894656,
          "used_in_bytes" : 31637712896,
          "free_percent" : 39,
          "used_percent" : 61
        },
        "swap" : {
          "total_in_bytes" : 0,
          "free_in_bytes" : 0,
          "used_in_bytes" : 0
        }
      }
    },
    "0tf2gWCmSpSjvoQBv58WhA" : {
      "os" : {
        "timestamp" : 1607710069896,
        "cpu" : {
          "percent" : 100,
          "load_average" : {
            "1m" : 5.24,
            "5m" : 5.69,
            "15m" : 5.87
          }
        },
        "mem" : {
          "total_in_bytes" : 51539607552,
          "free_in_bytes" : 20158423040,
          "used_in_bytes" : 31381184512,
          "free_percent" : 39,
          "used_percent" : 61
        },
        "swap" : {
          "total_in_bytes" : 0,
          "free_in_bytes" : 0,
          "used_in_bytes" : 0
        }
      }
    }
  }
}
Just for the reference this is happening on nodes that are running inside a container and are given 14 CPUs:
$ GET --query="_nodes?pretty&filter_path=nodes.*.os"
{
  "nodes" : {
    "VMHGhhkMSQaf2PfxnICtoA" : {
      "os" : {
        "refresh_interval_in_millis" : 1000,
        "name" : "Linux",
        "pretty_name" : "Red Hat Enterprise Linux Server 7.9 (Maipo)",
        "arch" : "amd64",
        "version" : "4.18.0-193.29.1.el8_2.x86_64",
        "available_processors" : 14,
        "allocated_processors" : 14
      }
    },
    "0tf2gWCmSpSjvoQBv58WhA" : {
      "os" : {
        "refresh_interval_in_millis" : 1000,
        "name" : "Linux",
        "pretty_name" : "Red Hat Enterprise Linux Server 7.9 (Maipo)",
        "arch" : "amd64",
        "version" : "4.18.0-193.29.1.el8_2.x86_64",
        "available_processors" : 14,
        "allocated_processors" : 14
      }
    },
    "rX711hApTOuSsXNMkwW8sQ" : {
      "os" : {
        "refresh_interval_in_millis" : 1000,
        "name" : "Linux",
        "pretty_name" : "Red Hat Enterprise Linux Server 7.9 (Maipo)",
        "arch" : "amd64",
        "version" : "4.18.0-193.29.1.el8_2.x86_64",
        "available_processors" : 14,
        "allocated_processors" : 14
      }
    }
  }
}
The top inside one of the containers shows:
top - 18:13:58 up 3 days,  1:03,  0 users,  load average: 3.37, 3.65, 4.29
Tasks:   5 total,   1 running,   3 sleeping,   0 stopped,   1 zombie
%Cpu(s): 18.5 us,  5.1 sy,  0.0 ni, 75.4 id,  0.1 wa,  0.5 hi,  0.3 si,  0.1 st
KiB Mem : 65938108 total, 20357232 free, 32044476 used, 13536400 buff/cache
KiB Swap:        0 total,        0 free,        0 used. 33922300 avail Mem

    PID USER      PR  NI    VIRT    RES    SHR S  %CPU %MEM     TIME+ COMMAND
      1 1000930+  20   0  218.2g  26.4g   1.1g S  38.7 42.0 325:37.09 java
    276 1000930+  20   0       0      0      0 Z   0.0  0.0   0:00.01 init.sh
  23799 1000930+  20   0   11836   3016   2592 S   0.0  0.0   0:00.03 sh
  39587 1000930+  20   0   11836   2976   2568 S   0.0  0.0   0:00.03 sh
  67761 1000930+  20   0   56208   3812   3252 R   0.0  0.0   0:00.00 top
Ok, I think this is related to cgroup stats, see os.cgroup namespace in:
https://www.elastic.co/guide/en/elasticsearch/reference/6.8/cluster-nodes-stats.html
Issue with very similar symptoms was reported in OpenJDK: https://github.com/AdoptOpenJDK/openjdk-support/issues/215 At this point I would recommend anyone hitting this error to check version of JVM they use and make sure it is 11.0.9 or later. It seems this can be a result of JDK bug: https://bugs.openjdk.java.net/browse/JDK-8248803
In any case, if you are hitting this error, please report your JVM version too.
On a general level make sure you follow JVM support matrix recommendations by Elastic: https://www.elastic.co/support/matrix#matrix_jvm
I also have same issue with ES v7.15.1, which use jdk 17. Is there anyone who solved this issue?
@tianshuang yes it was running in a docker container (using ECK operator). I'm no longer maintaining the setup so I can neither confirm or deny if upgrading JDK fixes the issue.
I had a similar problem and it was fixed after upgrading JDK minor version to fix version.