visualization-tool
 visualization-tool copied to clipboard
The tool for visualizing Swiss Open Government Data. Project ownership: Federal Office for the Environment FOEN

**Is your enhancement related to a problem? Please describe.** Currently when selecting for example 5 filters it already happens that we have a duplication of colors, that need to be...
Just a place to drop the URLs of the graphs for the regression tests...
Currently we do not have any picture attached to a preview of the page when sharing a link to a published chart e.g. on social media. It could be a...
For initial loading performance, we should only load the locale we are interested in. Right now, all locales are loaded. > https://github.com/visualize-admin/visualization-tool/blob/5671fc624d9f6423400219e57eff83b7c43c5eb2/app/locales/locales.ts#L1
Can we make the scrollbar in the left sidebar a bit more subtle? **Status quo:** Mockup: 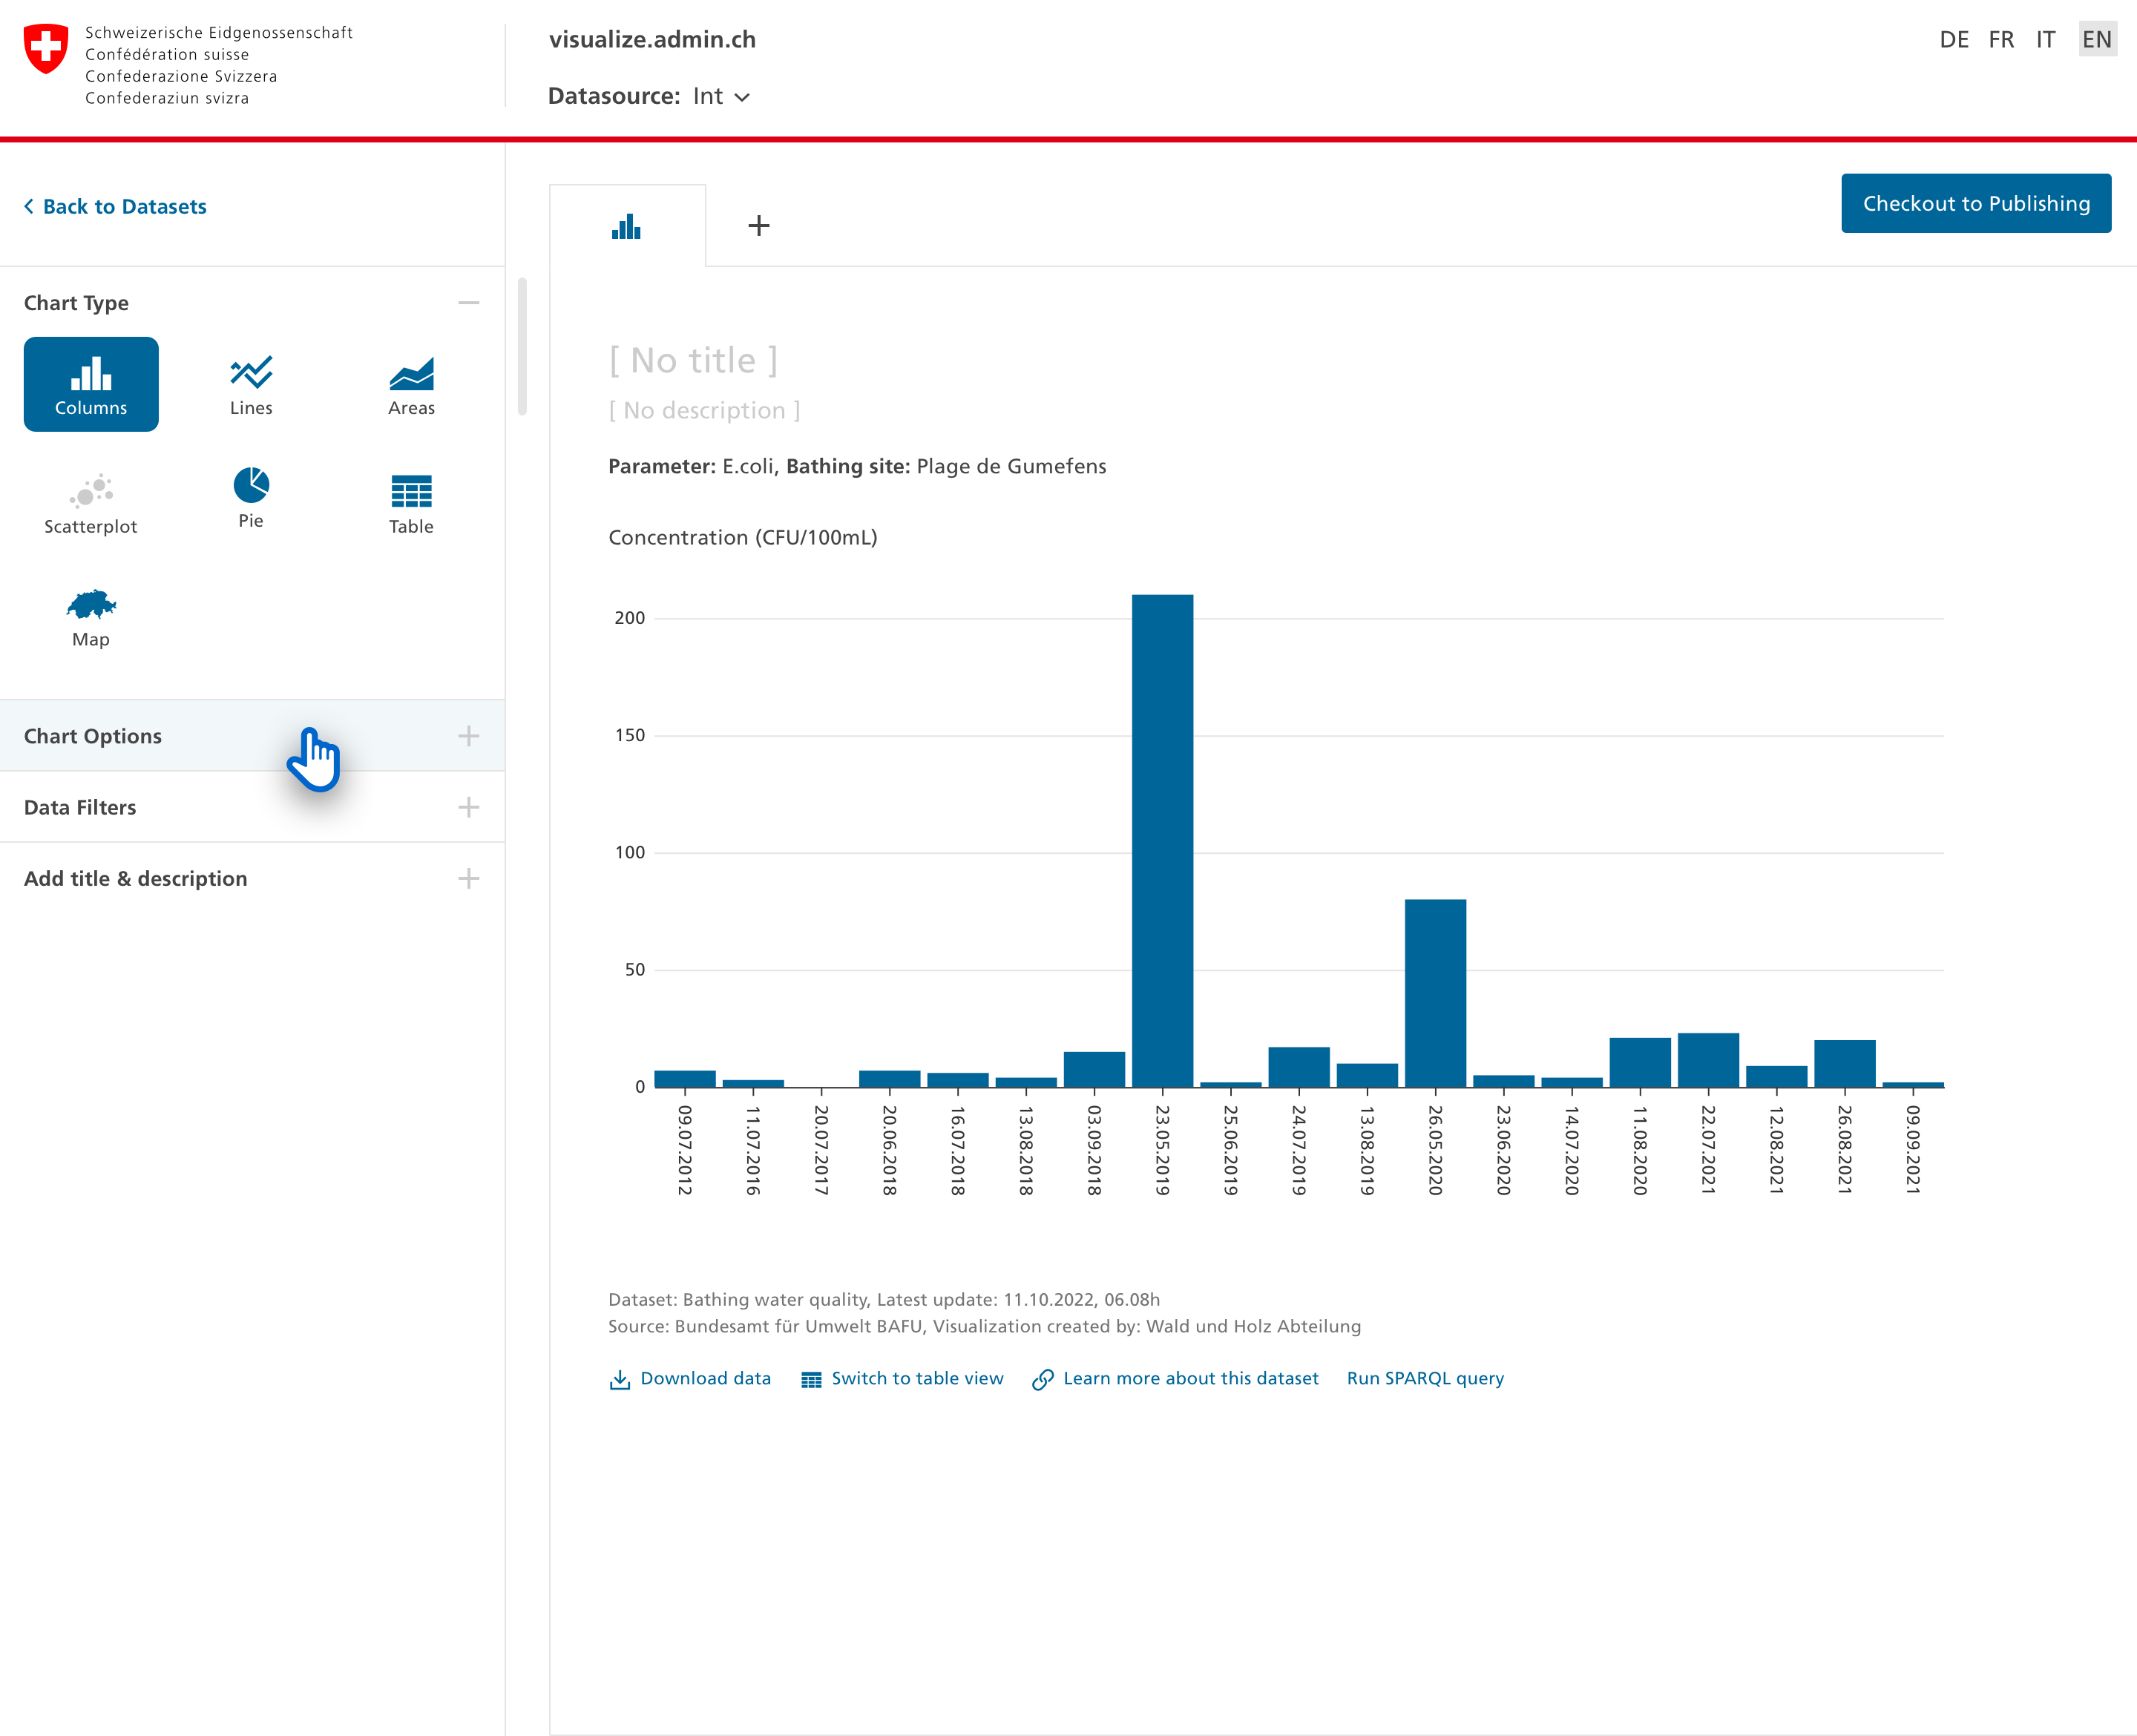
**Is your feature request related to a problem? Please describe.** Right now users can choose the same measure to color shapes (areas) and coordinates (symbols). This doesn't make a lot...
**Is your feature request related to a problem? Please describe.** To continue the reported issue [here]( https://github.com/visualize-admin/visualization-tool/issues/596 ): What I find a bit irritating here is that the "Schweiz is...
**Is your feature request related to a problem? Please describe.** That is a out of band feature request for a non-branded visualize instance. It was discussed with @sosiology @wiederkehr and...
**Is your feature request related to a problem? Please describe.** Sometimes you have data that looks very complicated and messy in a Visualize chart, but that could be made much...
**Is your feature request related to a problem? Please describe.** There are cubes with more than one measure (ex: [EnergiePerspektiven](https://[visualize.admin.ch](https://visualize.admin.ch/it/v/MBK9KysRnOEF)/it/v/MBK9KysRnOEF) have _Energieverbrauch_ and _Treibhausgasemissionen_). Today I need two completely separate...
Metadata
Owner
Metadata
The tool for visualizing Swiss Open Government Data. Project ownership: Federal Office for the Environment FOEN