visualization-tool

visualization-tool copied to clipboard
Displaying line charts on the smartphone: x-axis labels
We are currently looking at how the graphics appear on the smartphone. The following improvement should be made :
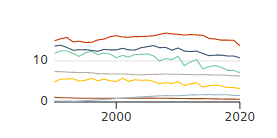
In the line chart, only very few years are shown on the smartphone. In particular, the starting year (1990) is missing. Depending on the use case, the number of years can of course vary greatly. However, it would be important that the first year is displayed. A "meaningful" interval should be chosen for the further years (1 year, 2, years, 5, 10,...).
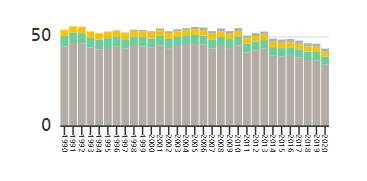
In the bar chart, all years (rotated by 90°) are present.