visualization-tool

visualization-tool copied to clipboard
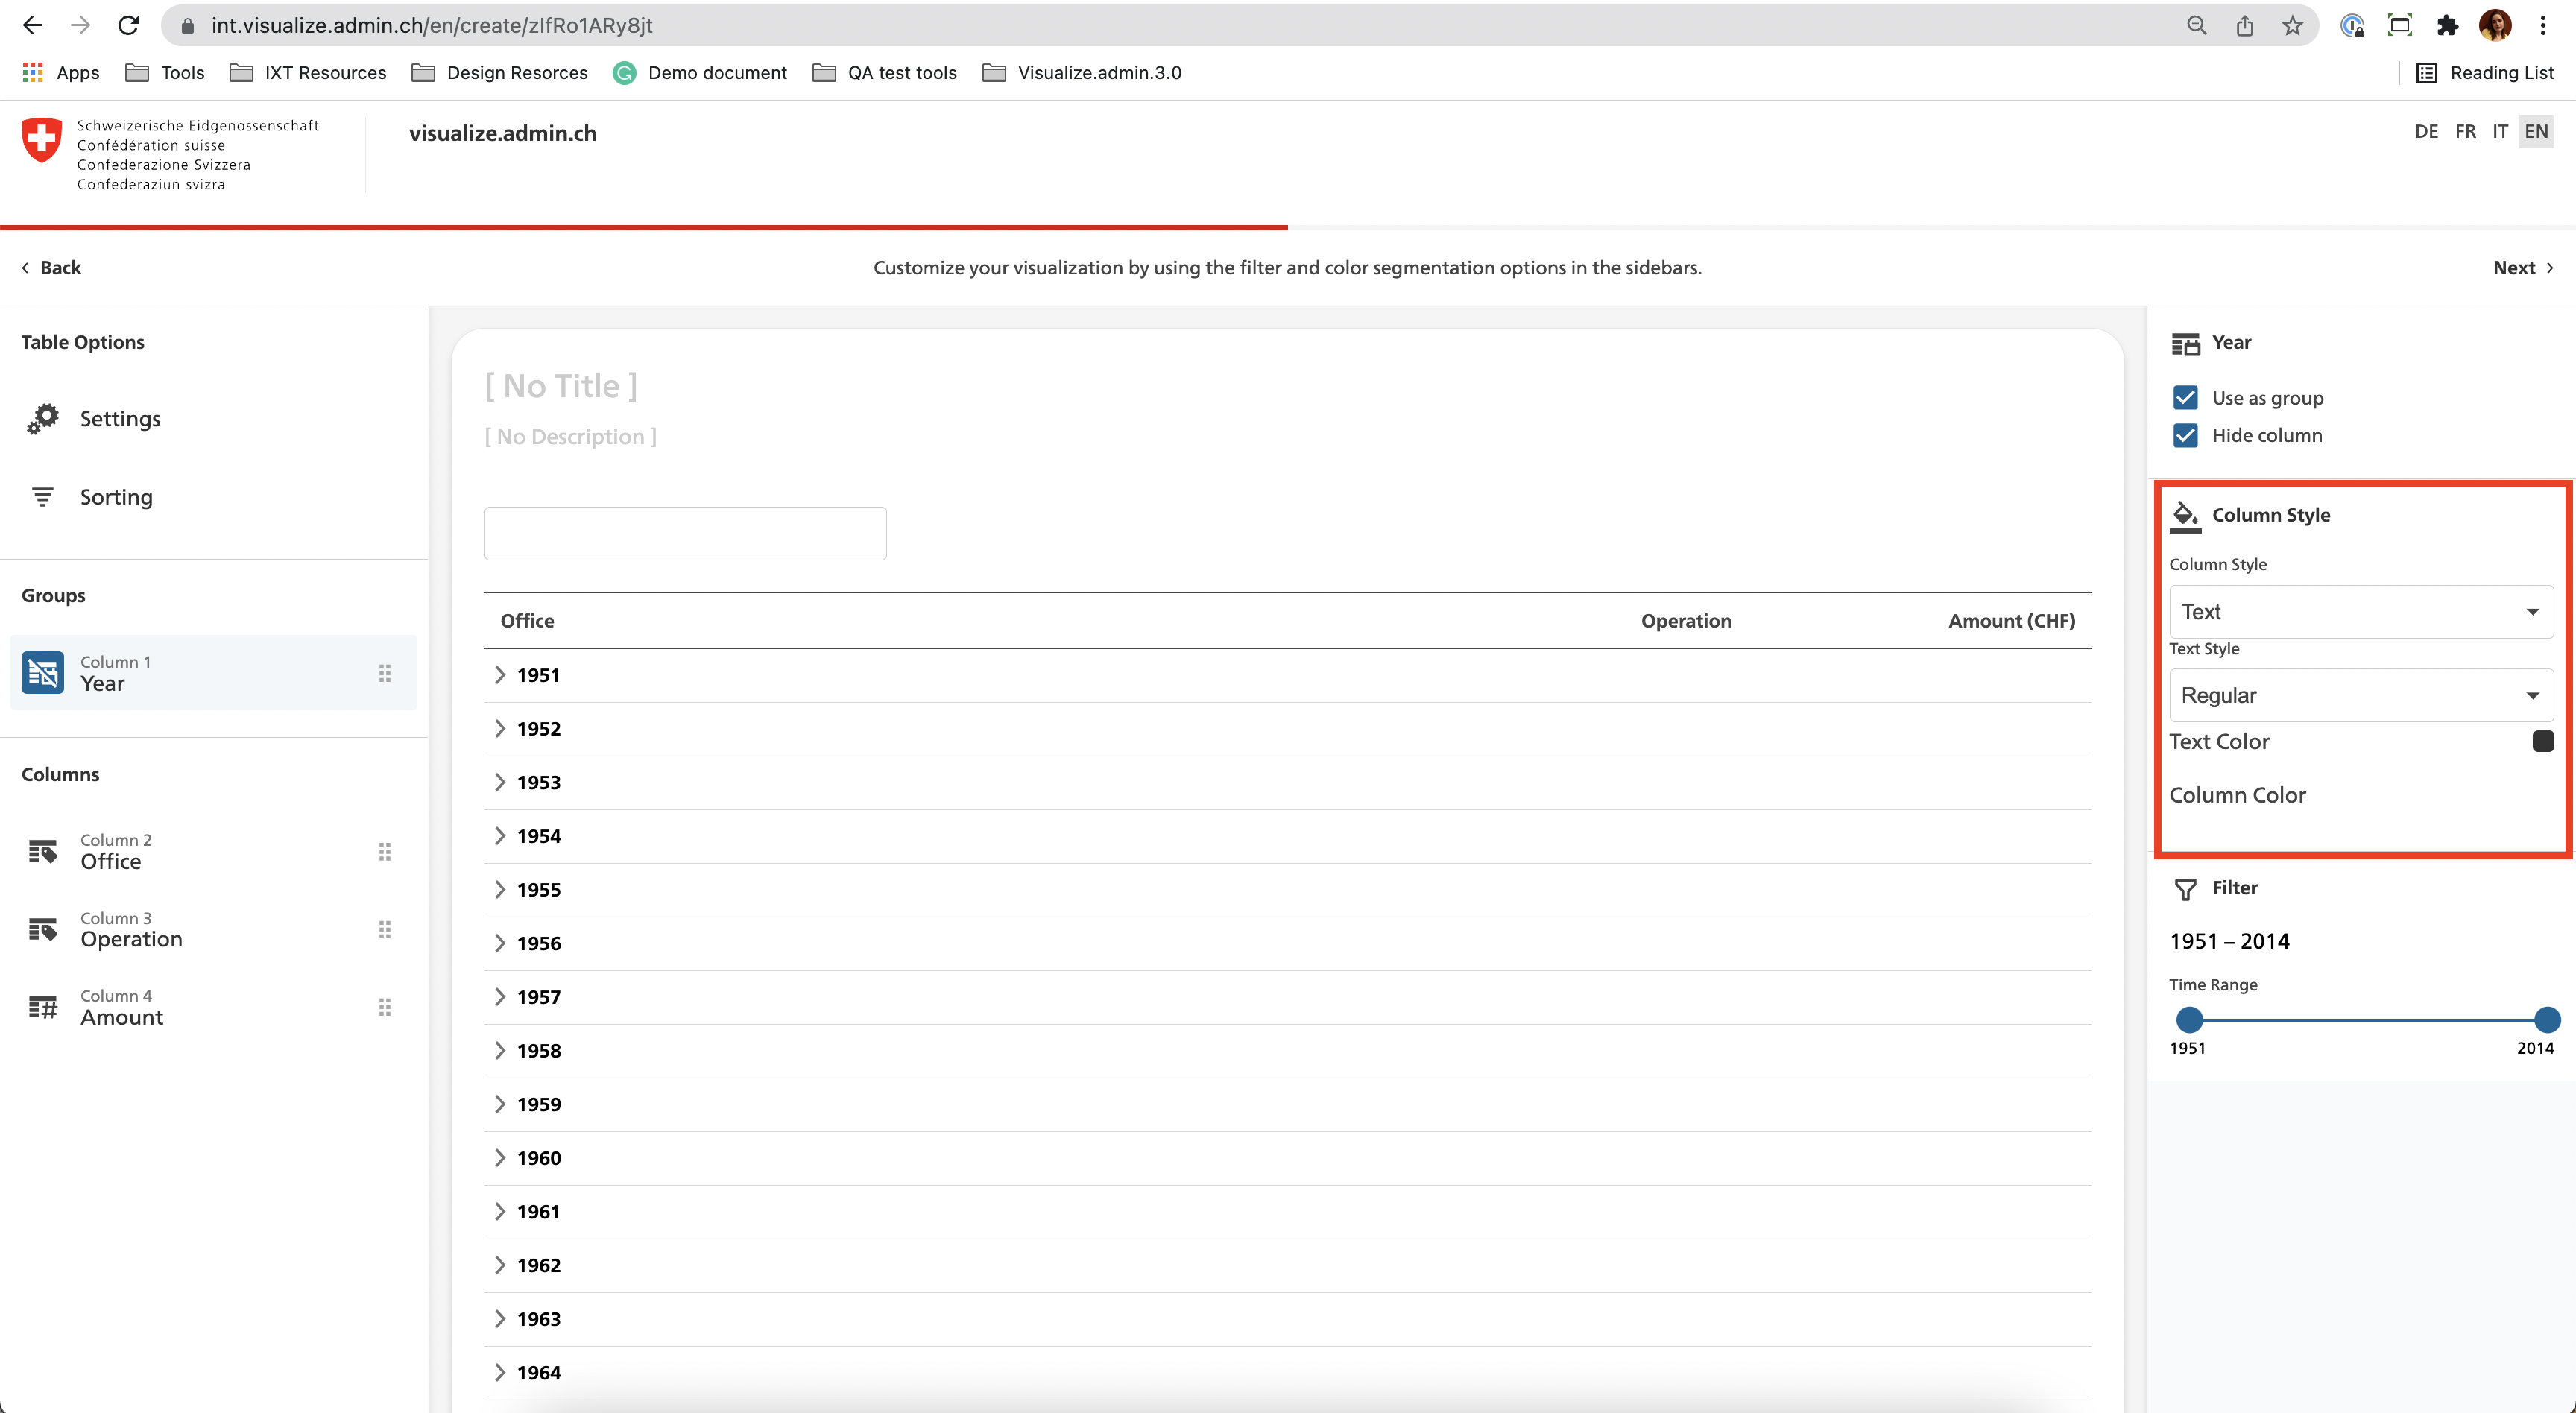
Table chart: Remove style option once "use as group" and "hide column" are selected
Describe the bug Once the user selects the table option, a series of filters are available depending on the column. Some style options are available even though they are not required. In addition, the drop-downs are too close together and it would be better to space them out.
To Reproduce Steps to reproduce the behavior:
- Create a visualisation from State accounts - Office dataset
- Click on Table option/chart
- Select the column year
- Select on the right panel use as group and hide column
- Column style section is available. Options to change the text style are not working accordingly.
Expected behavior
- [ ] No Text style options should be displayed once use as group and hide column are selected.
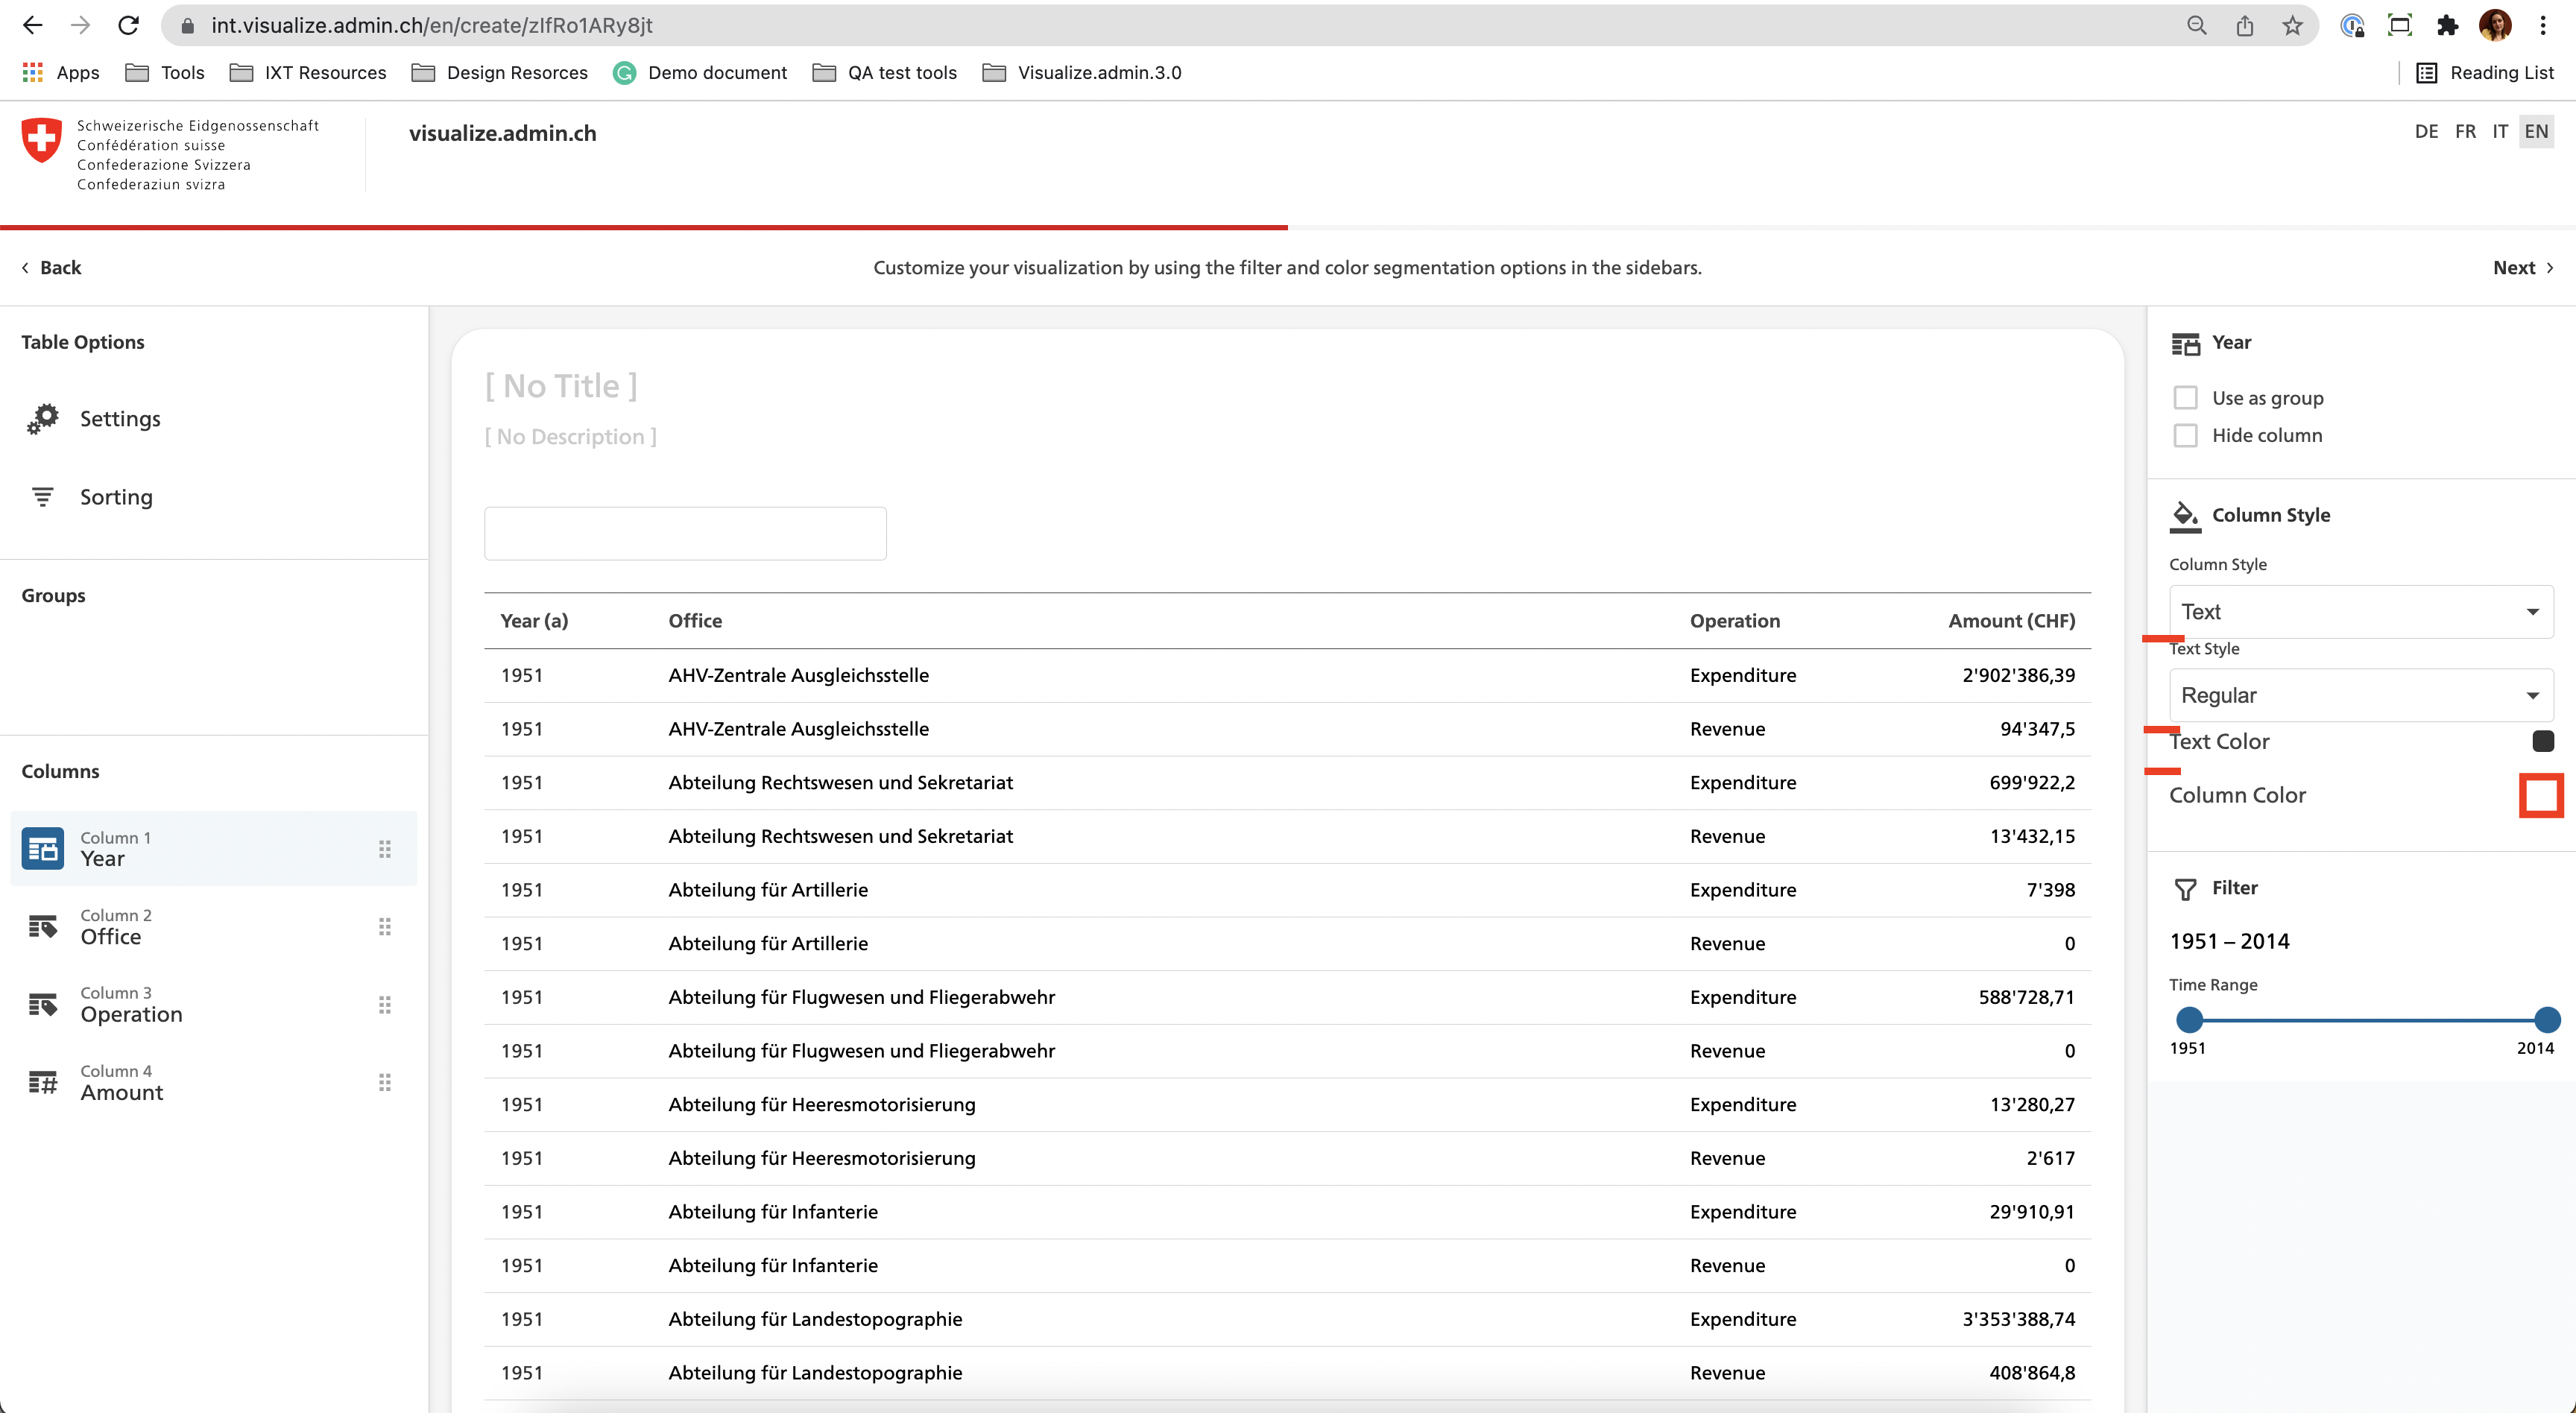
- [x] The space between the panel elements is not respected, please add 16 px between the elements.
- [x] Add a grey border to the column color box, otherwise, it is not visible. (by default it is white as the background).
Screenshots
Environment:
- Visualize environment and version: [e.g. INT v3.4.1]
- Browser and version [e.g. Chrome 97]