visualizing where time goes in vg map, bwa mem, and minimap2
I'd like to share some visualizations that suggest where runtime is going in several of our favorite mappers.
The point of doing this is to foster conversation on how to write fast read aligners. I'll contend that we need to do less, in every sense. It's not just enough to have smart algorithms. They need to be implemented in the cleanest way possible.
Here we go.
- Build a graph and simulate 100k read pairs from it:
vg construct -r 1mb1kgp/z.fa -v 1mb1kgp/z.vcf.gz -m 32 -p >z.vg
vg index -x z.xg -g z.gcsa -p z.vg
vg sim -x z.xg -n 100000 -l 150 -p 1000 -v 100 -e 0.01 -i 0.005 -a >z.illumina.100k.pairs.sim
Extract fastqs:
vg view -a z.illumina.100k.pairs.sim | jq 'select(.fragment_next != null)' | vg view -JaG - | vg view -X - | sed 's/_1$//' >z.illumina.100k.pairs.sim_1.fq.gz
vg view -a z.illumina.100k.pairs.sim | jq 'select(.fragment_prev != null)' | vg view -JaG - | vg view -X - | sed 's/_2$//' >z.illumina.100k.pairs.sim_2.fq.gz
Run some tests with various methods, using valgrind:
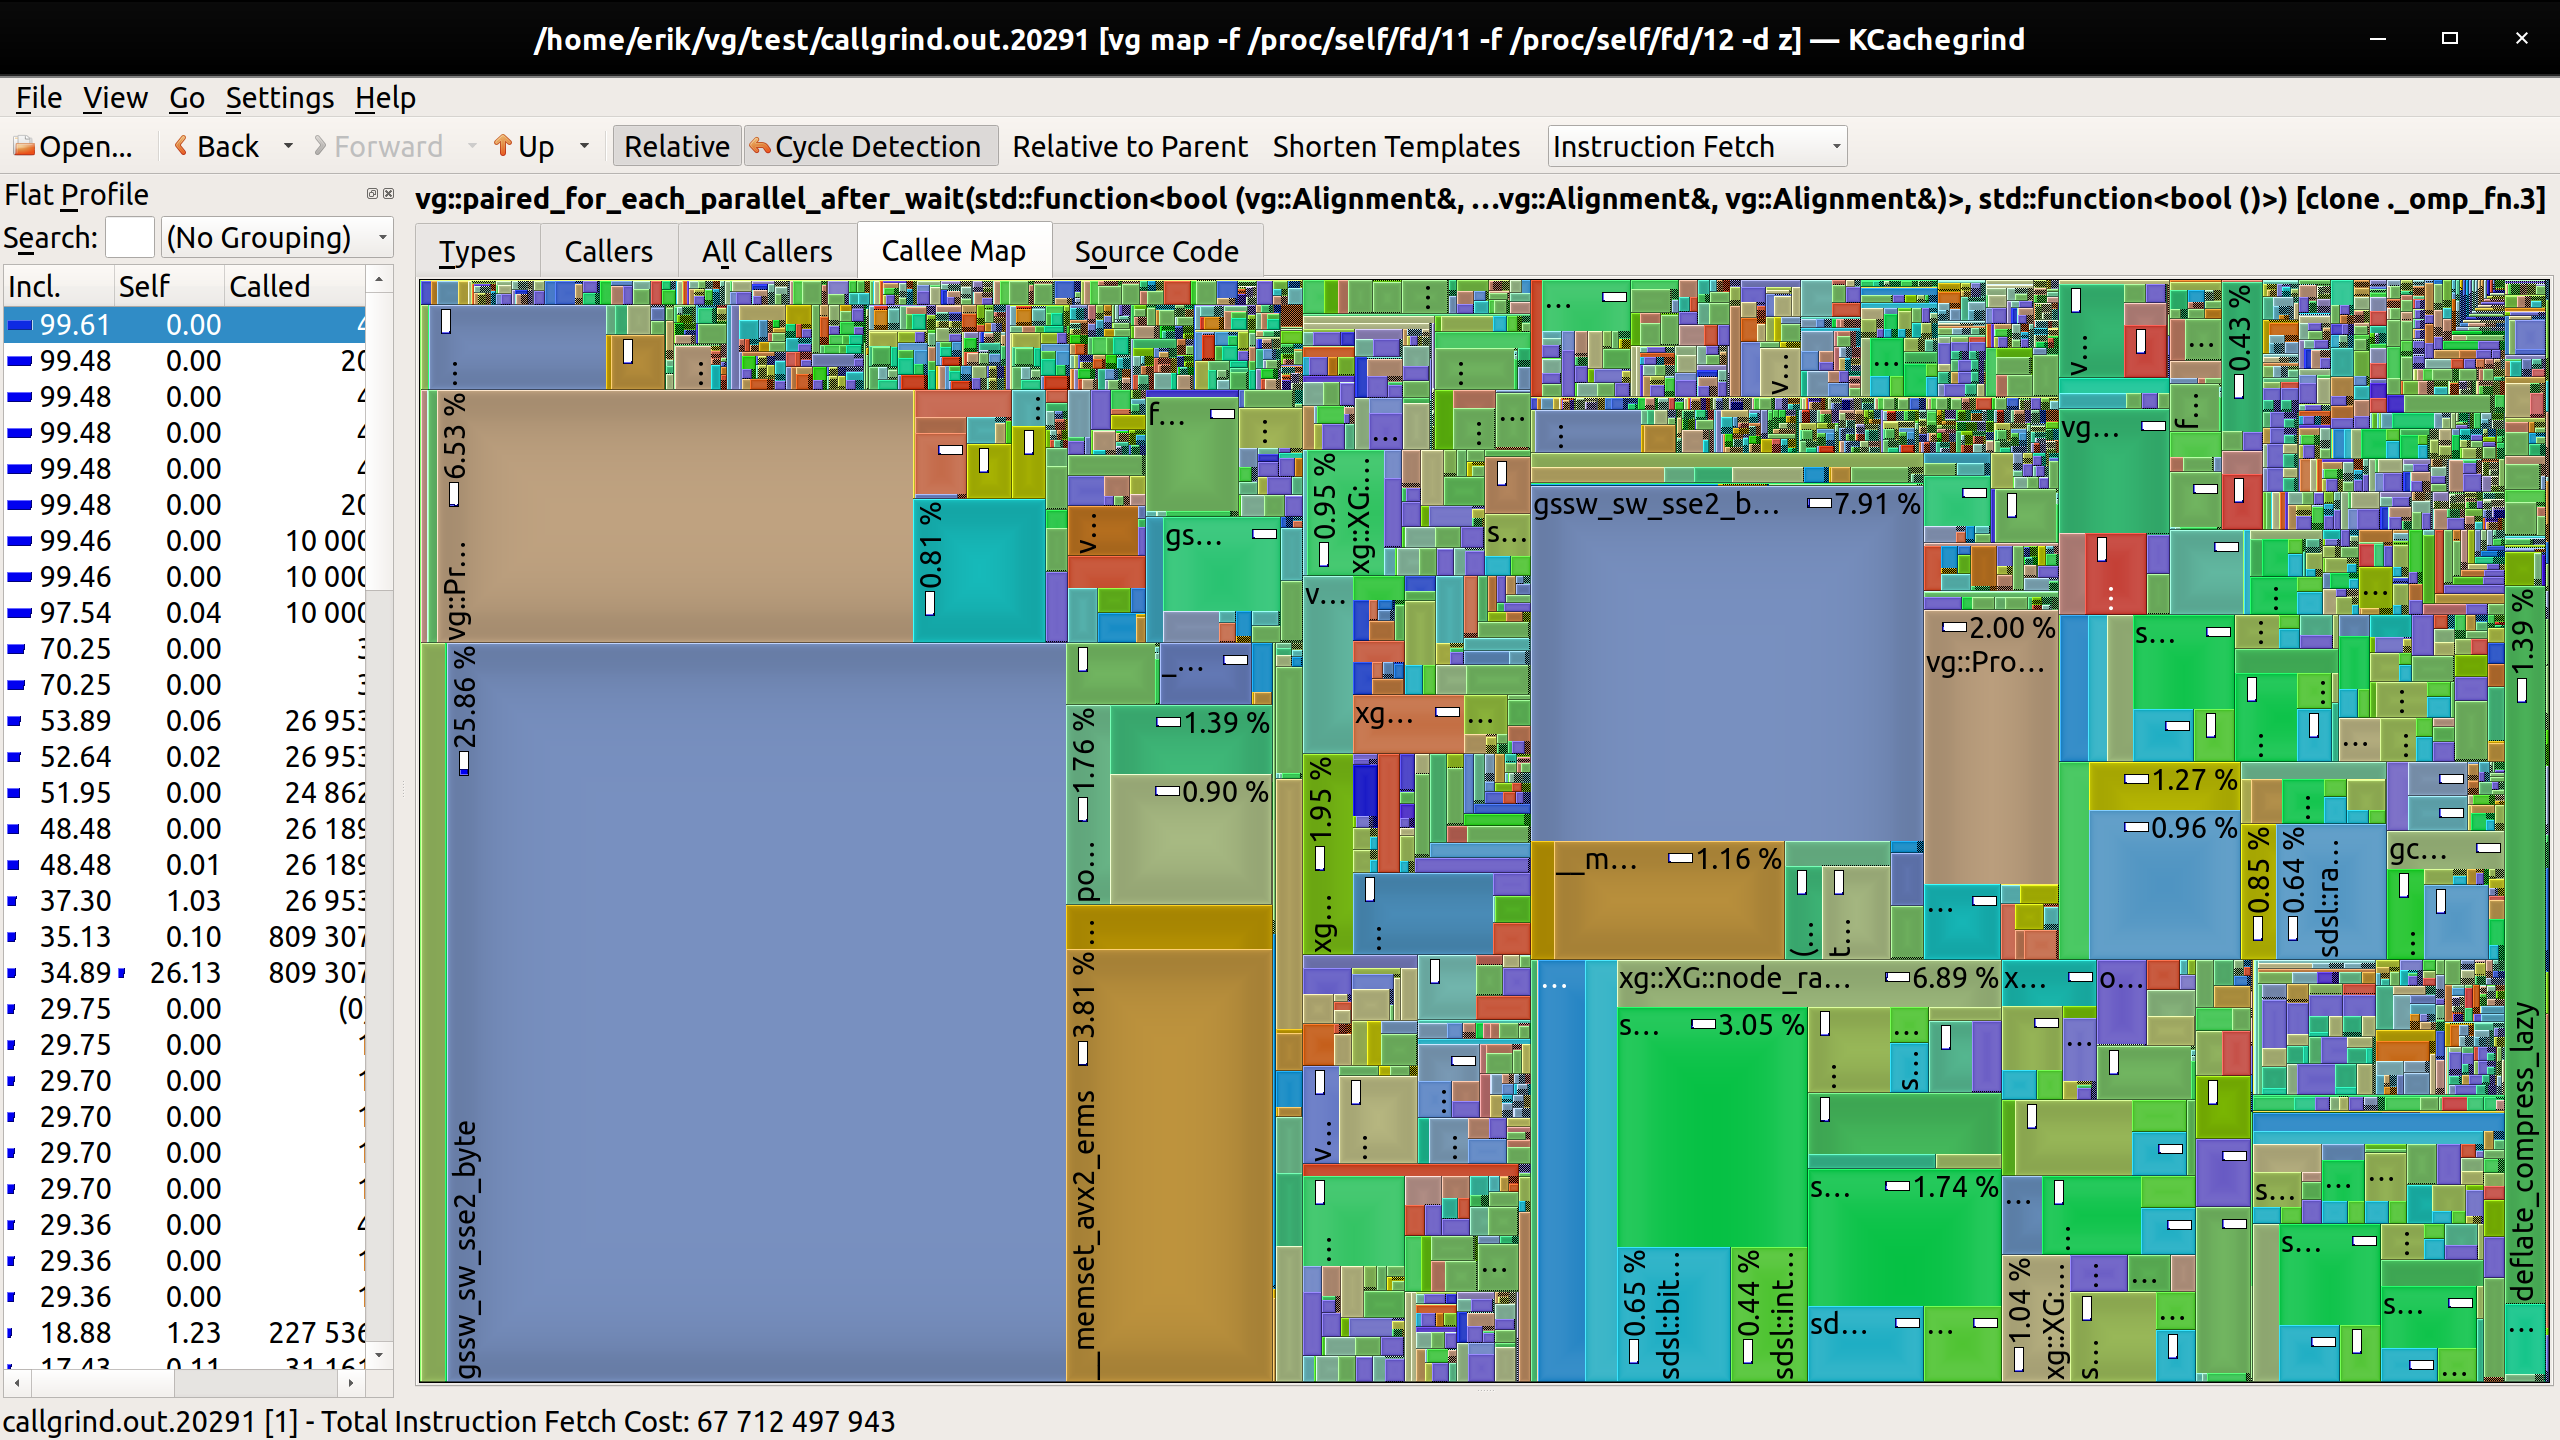
vg map, paired, default
valgrind --tool=callgrind vg map -f <(head -40000 z.illumina.100k.pairs.sim_1.fq) -f <(head -40000 z.illumina.100k.pairs.sim_2.fq ) -d z >/dev/null
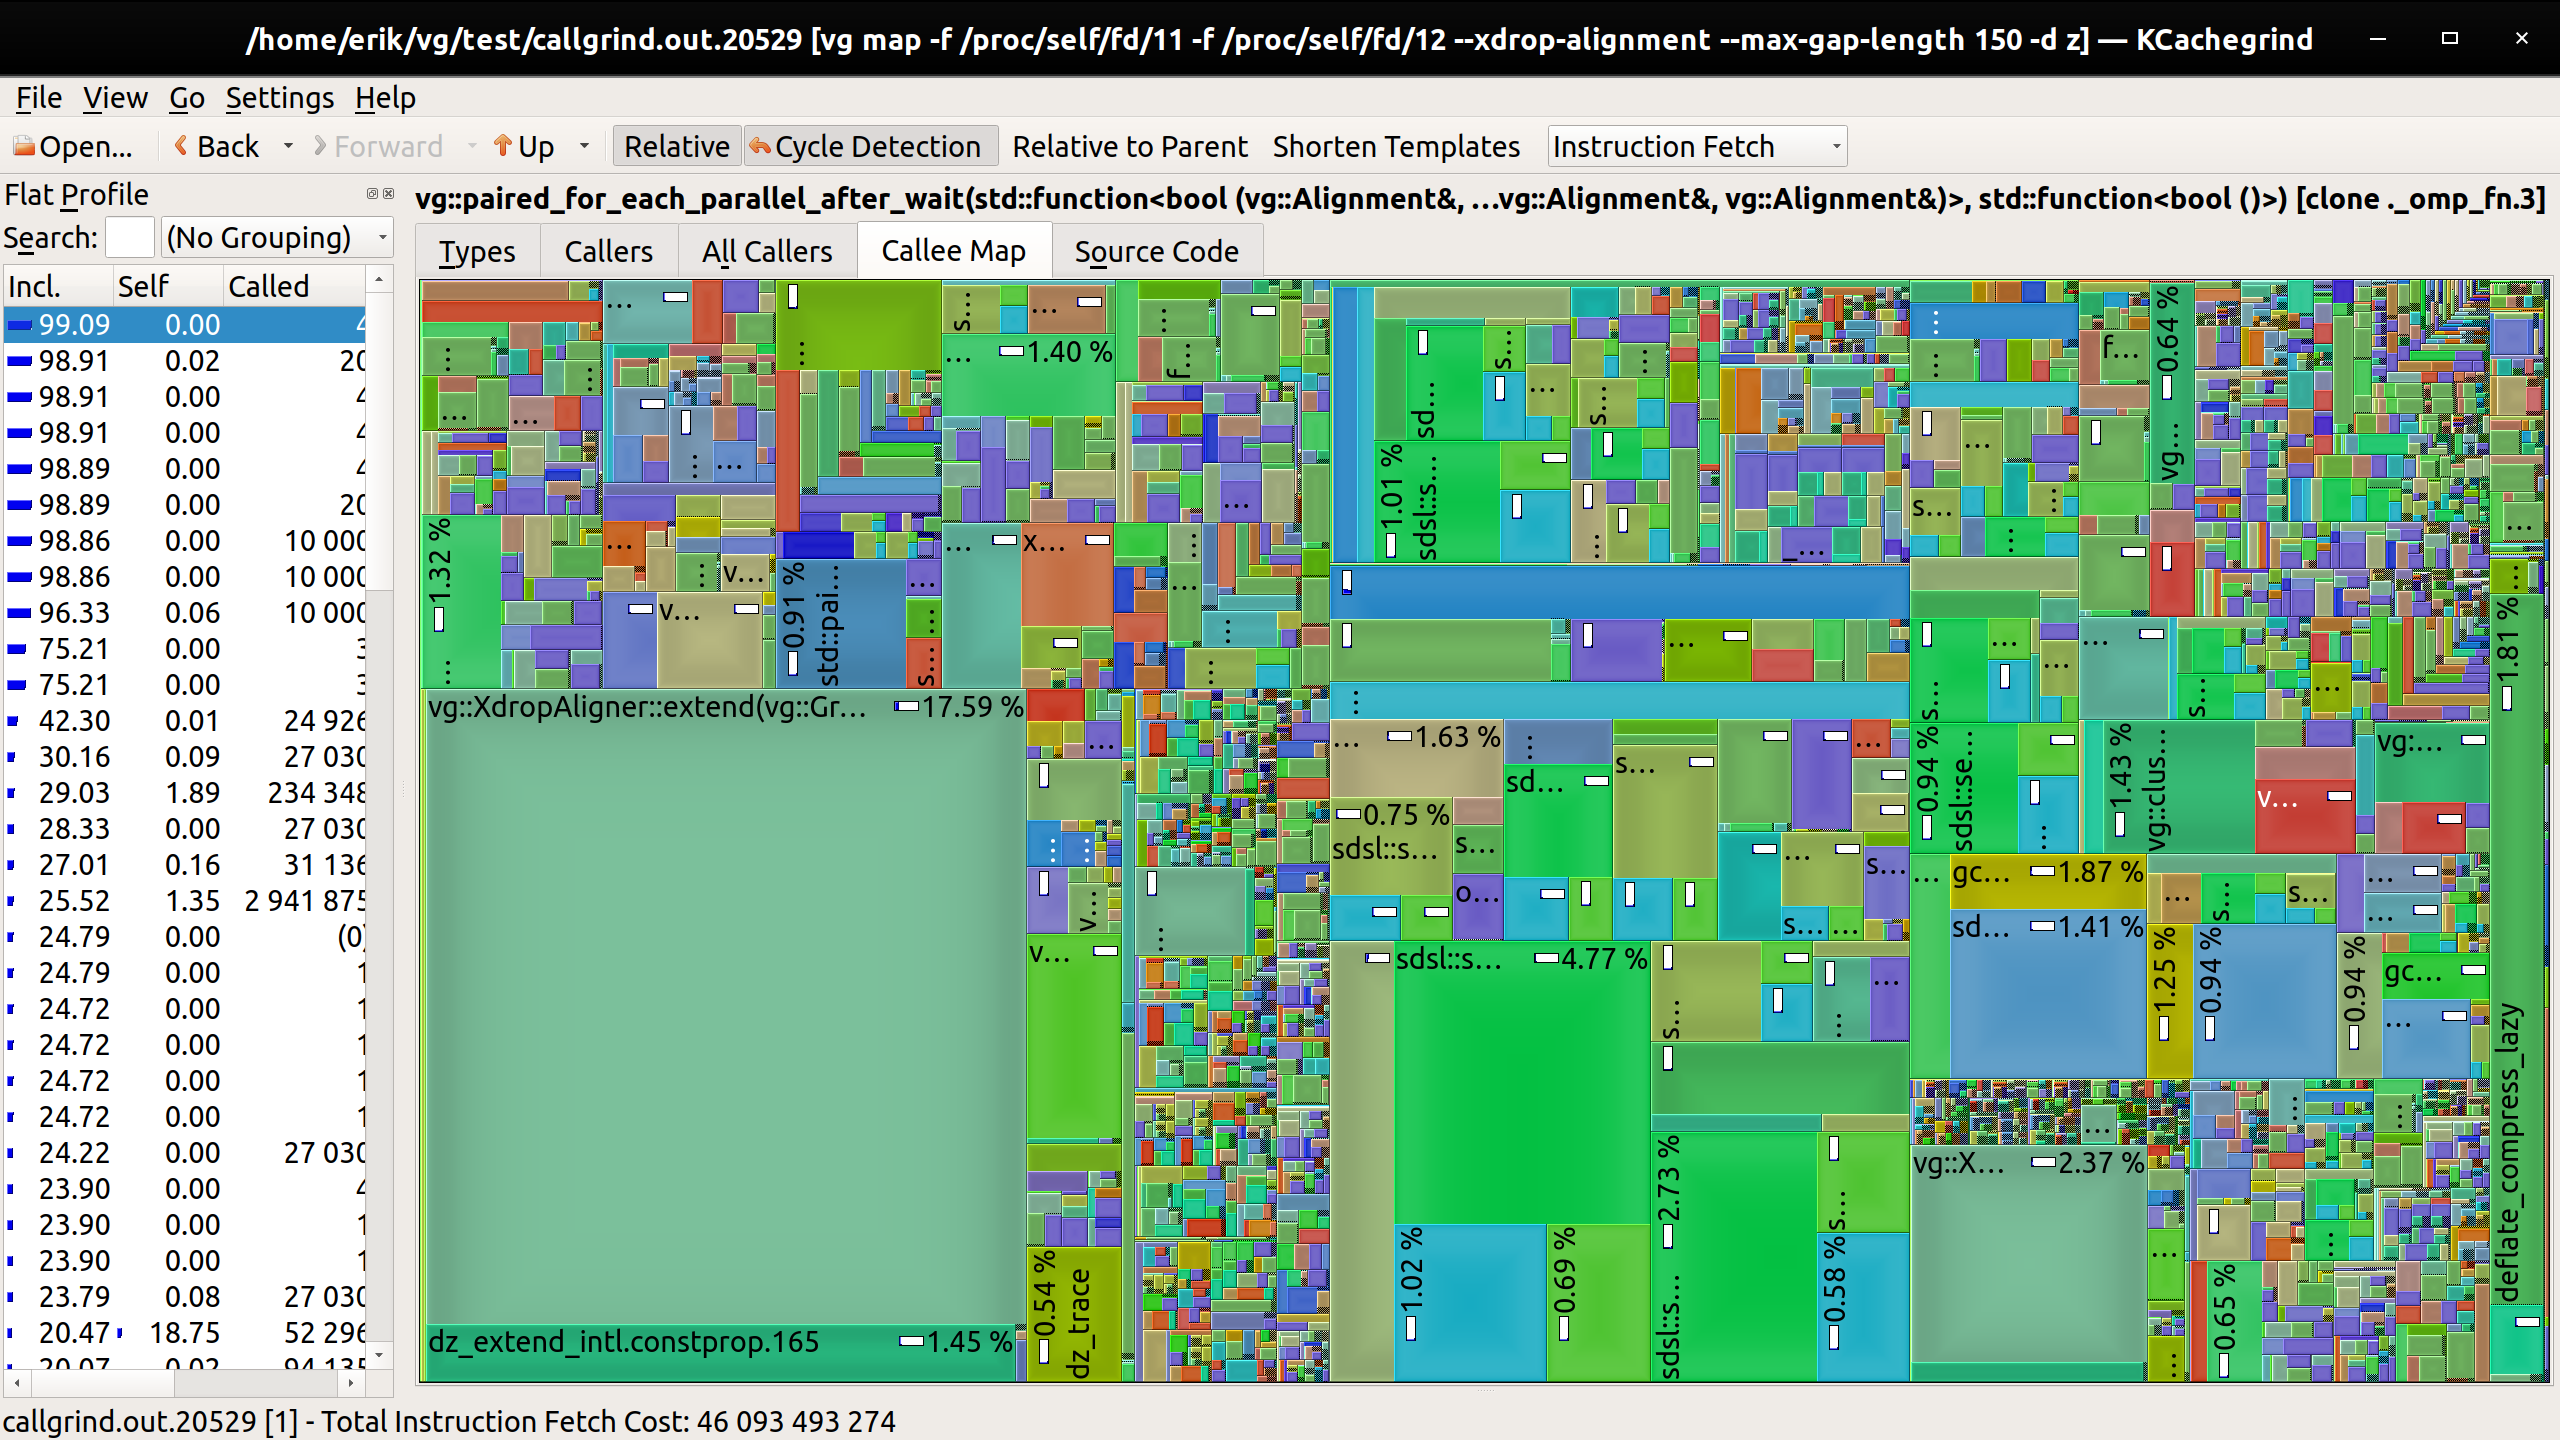
vg map, paired, xdrop
valgrind --tool=callgrind vg map -f <(head -40000 z.illumina.100k.pairs.sim_1.fq) -f <(head -40000 z.illumina.100k.pairs.sim_2.fq ) --xdrop-alignment --max-gap-length 40 -d z >/dev/null
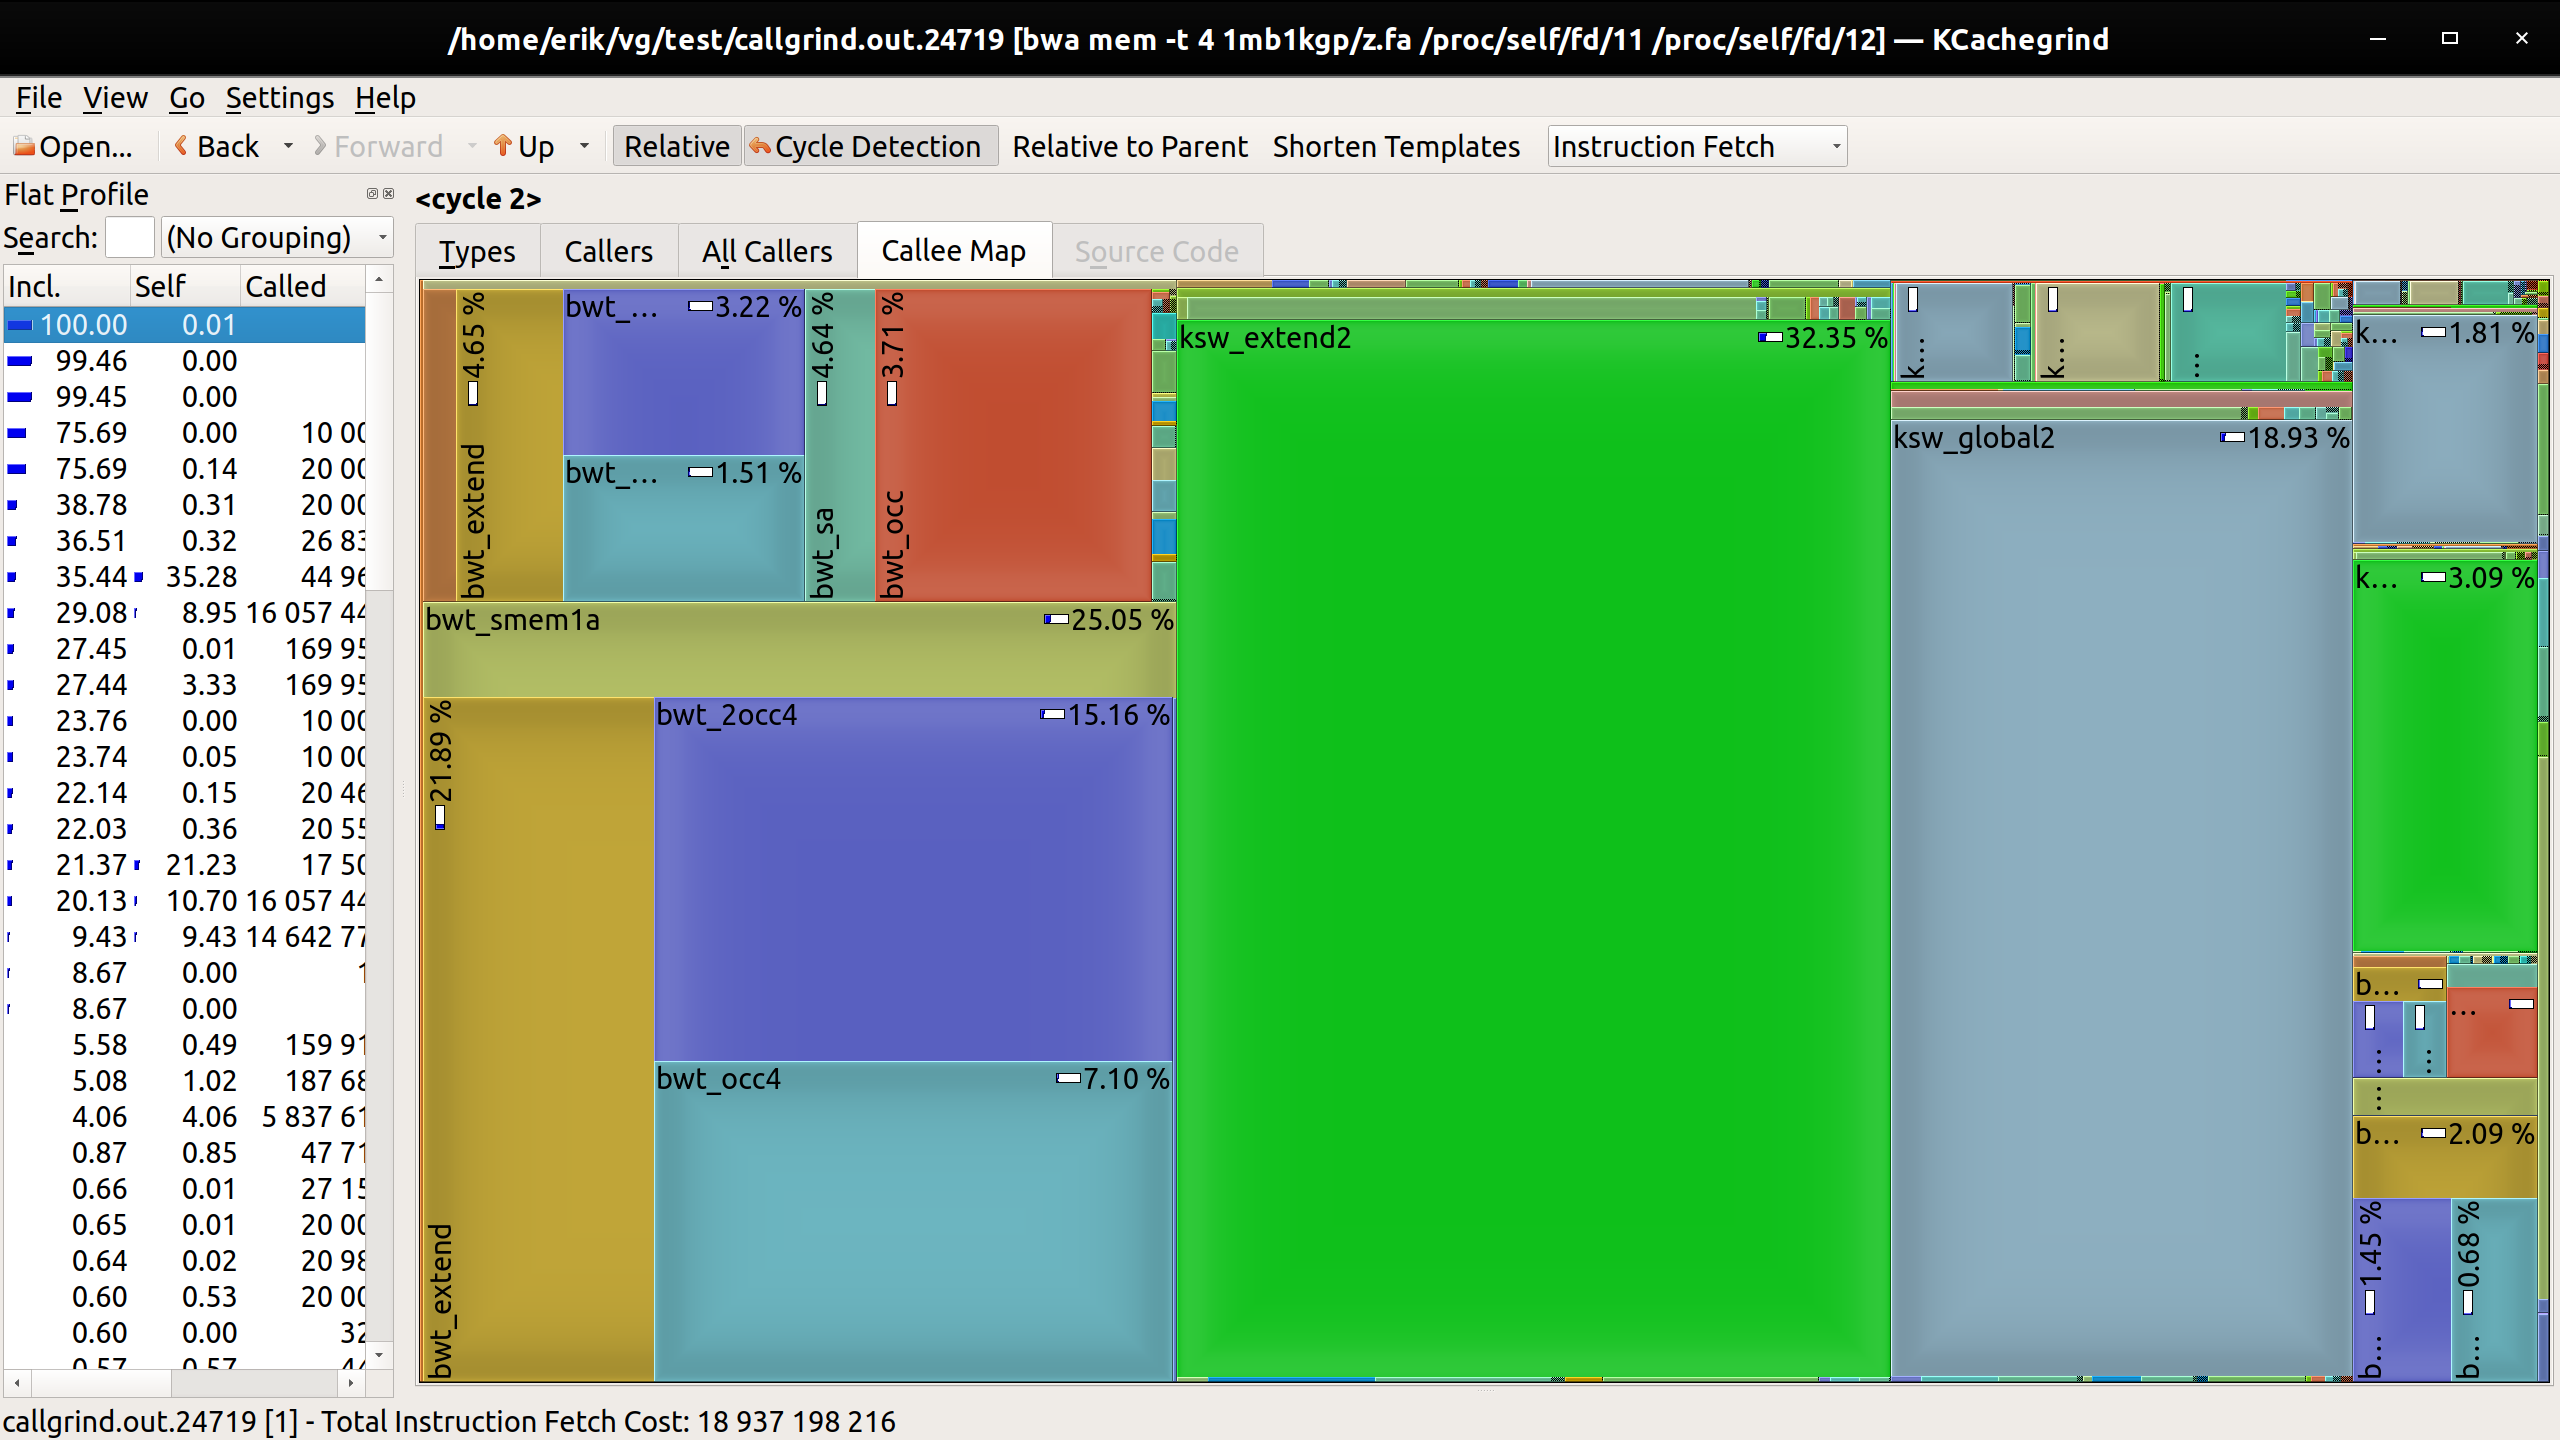
bwa mem, paired
valgrind --tool=callgrind bwa mem -t 4 1mb1kgp/z.fa <(head -40000 z.illumina.100k.pairs.sim_1.fq) <(head -40000 z.illumina.100k.pairs.sim_2.fq ) >/dev/null
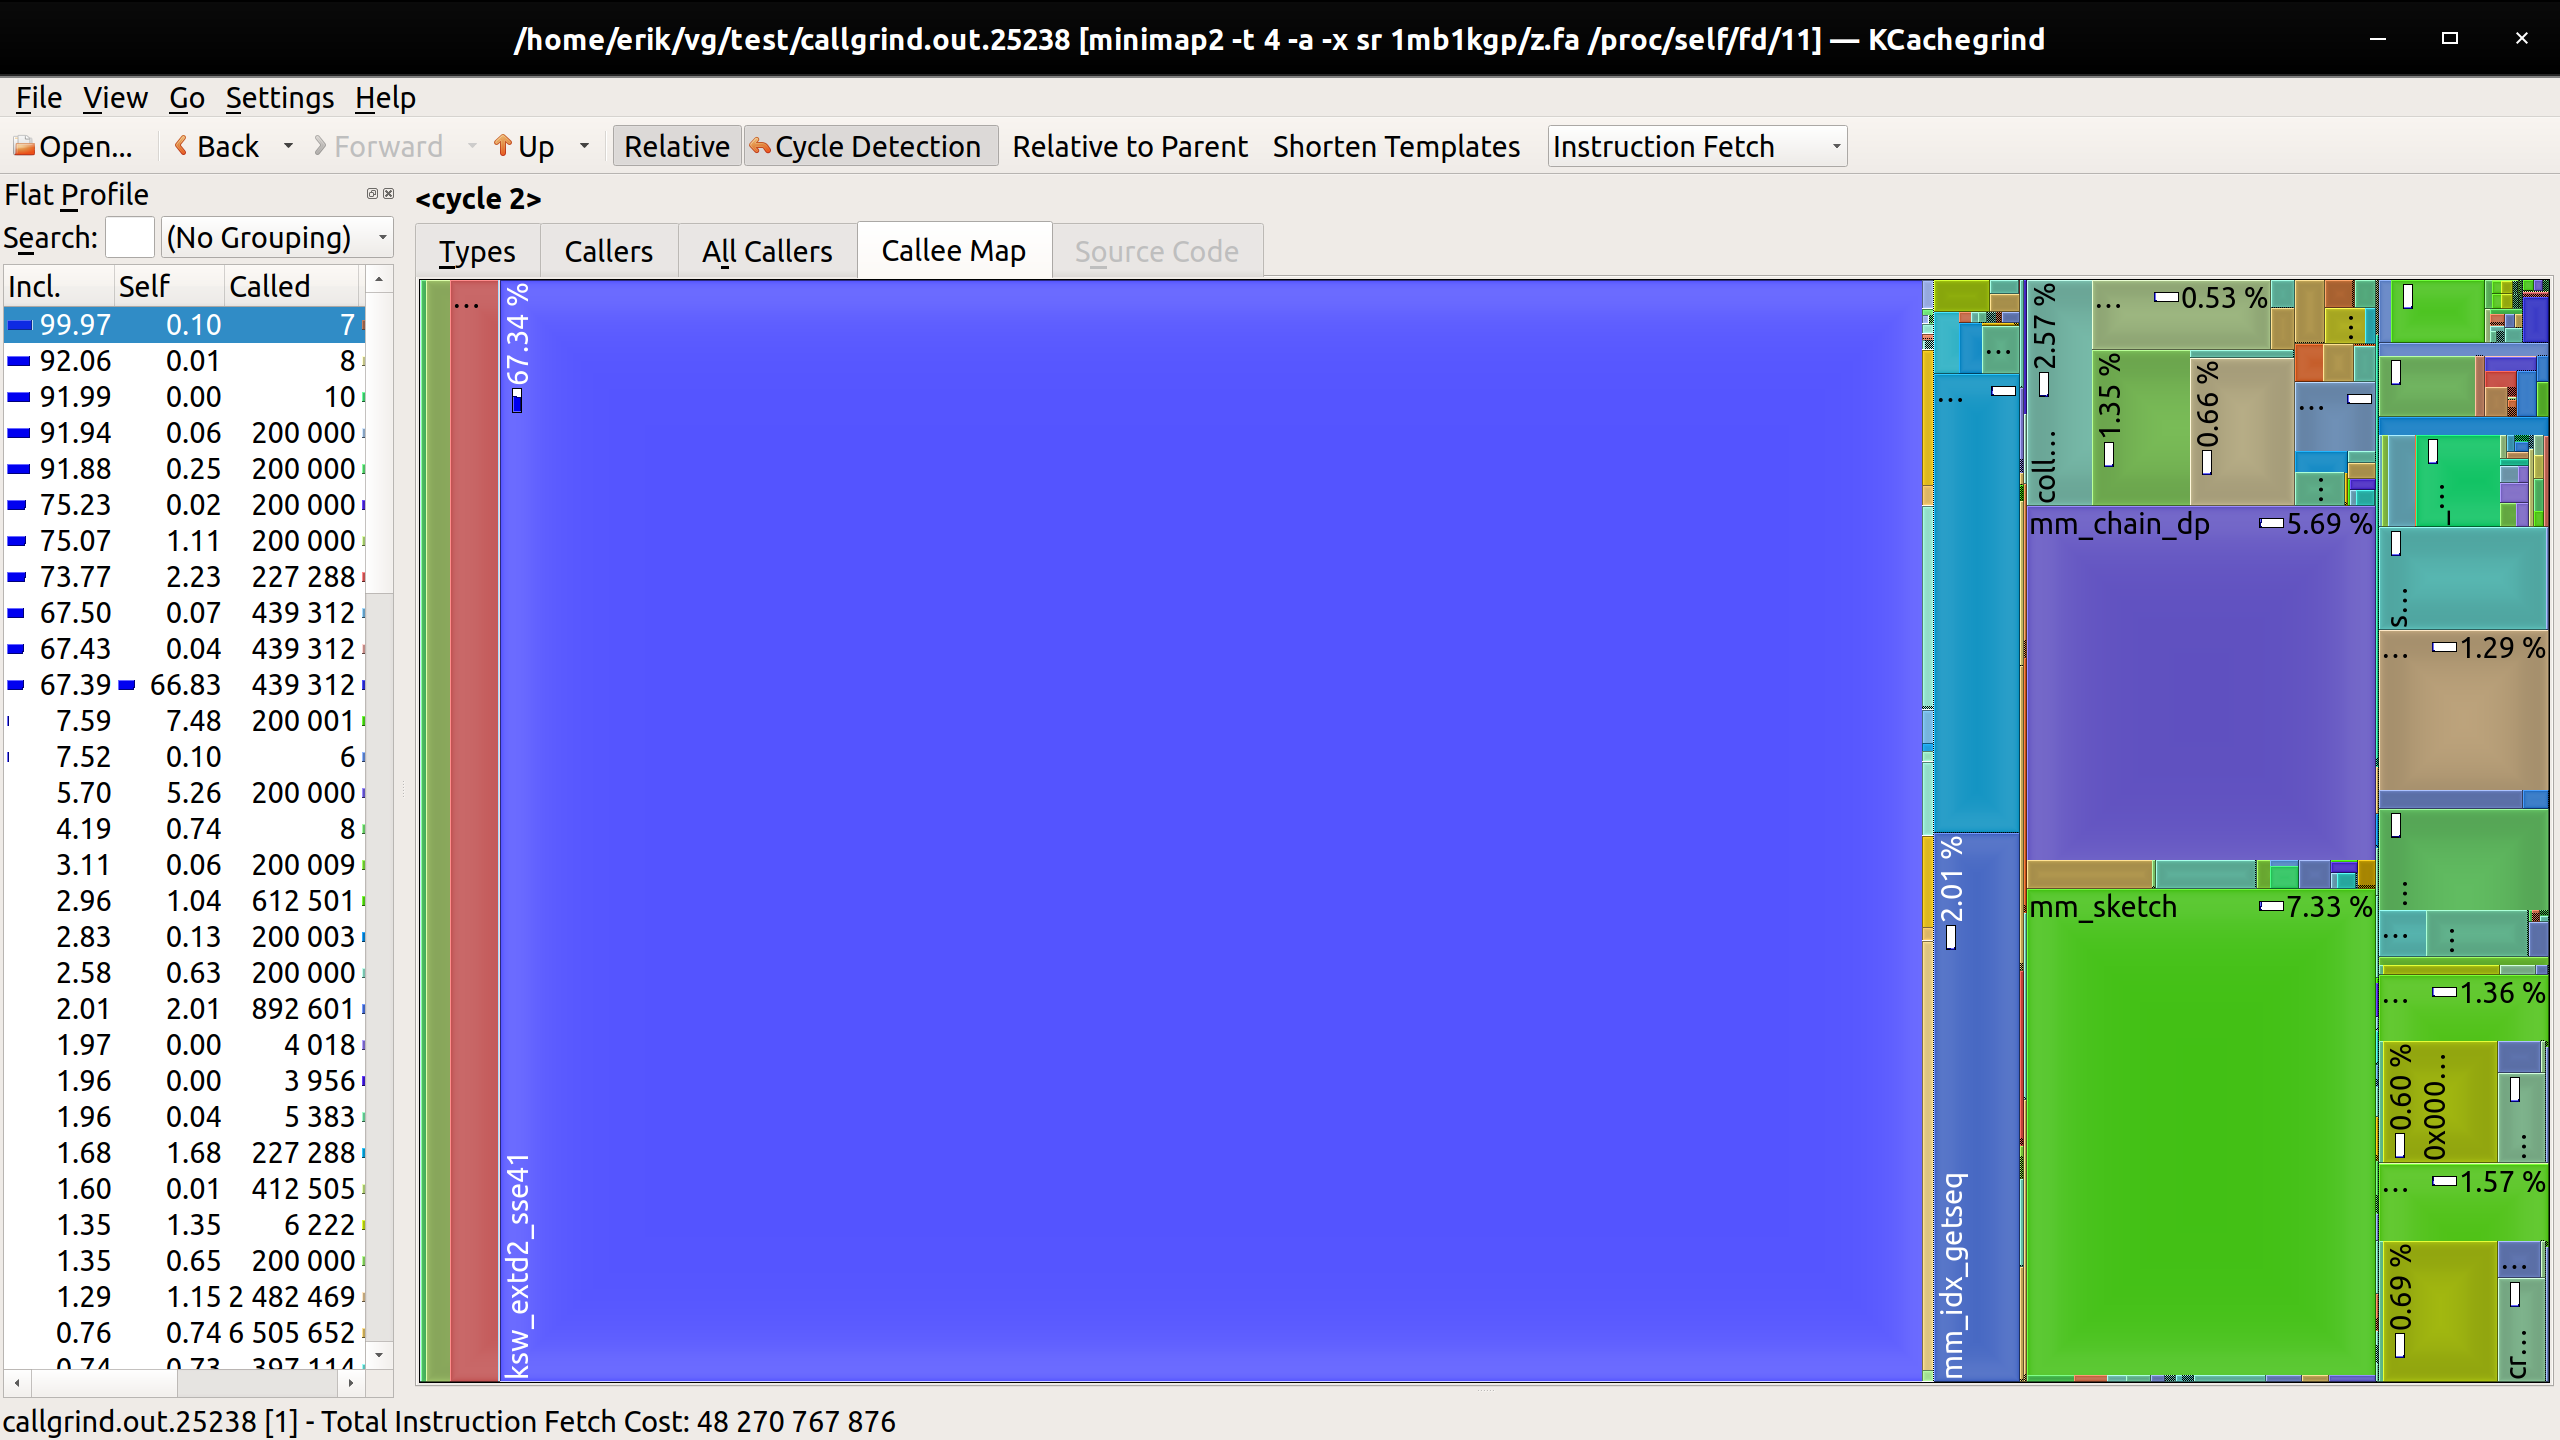
minimap2, unpaired
valgrind --tool=callgrind minimap2 -t 4 -a -x sr 1mb1kgp/z.fa <(head -80000 z.illumina.100k.pairs.sim.fq.gz ) >/dev/null
They are ordered from slowest to fastest. I didn't extract exact timings. vg map runs something like 1.5k reads/vCPU/s on my laptop (~5.5-6k/s). bwa is several times faster, and minimap2 is several times faster than bwa mem.
We can get some idea of the relative behavior of these just by looking at these kcachegrind renderings:
vg map
vg map --xdrop
bwa mem
minimap2