An attempt to make time scale work with color schemes
Hi, I recently faced an issue when trying to map time/temporal domain to a color scheme like "turbo".
For example the following code
const data = _.range(10).map(x => ({u: x, v: new Date(2000 + x, 1, 1)}));

embed({
  width: 640,
  mark: { type: "circle", opacity: 1, size: 400 },
  data: {
    values: data
  },
  encoding: {
    x: { field: "u", type: "quantitative" },
    color: {
      field: "v",
      type: "temporal",
      scale: { scheme: "turbo" },
      legend: { orient: "top", format: "%Y" },
    }
  },
});
produces
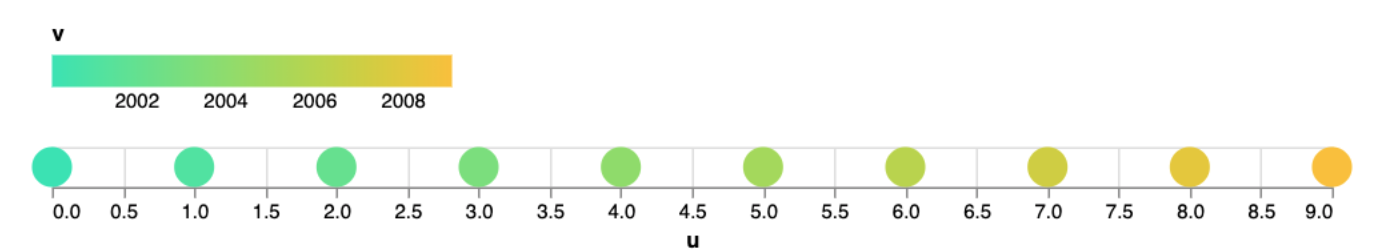
Which is probably not what you would expect from "turbo" color scheme.
I originally posted this as question it in vega-lite discussions, but later I realized that it is more a vega issue, rather than vega-lite.
For comparison I created the same plot using observable/plot:
Plot.plot({
  color: {
    legend: true,
  },
  marks: [
    Plot.dotX(data, {x: "u", fill: "v", r: 10})
  ]
})
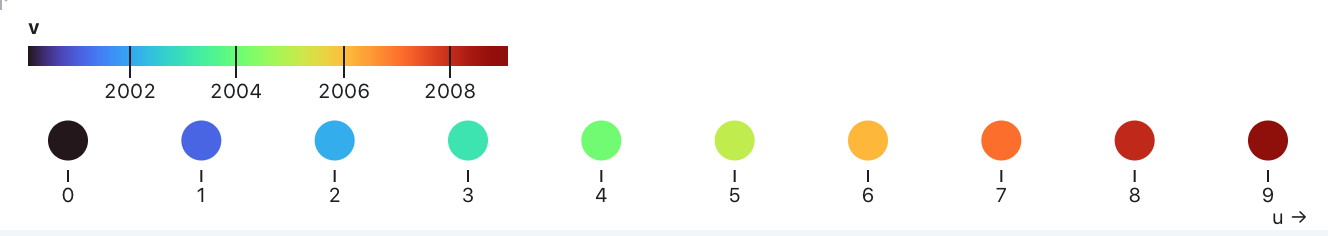
and it correctly mapped time to colors, as I would expect:
As both vega and observable/plot use d3-scales under the hood, one might wonder, where does the difference come from. So here is my dive into the world of scales started. TBH, it looked pretty convoluted, at least when you look into it for the first time. I still have questions like why you need linear and sequentiaLinear as separate scales, or why in some scales you have interpolator, but in other scales it is called interpolate.
So, what I realized is that in order color schemes to work you need to use sequential variant of the scales. But there is no scaleSequentialTime in d3. How does observable/plot then work? Looks like it doesn't use sequential scales at all. So, instead of:
scale = d3.scaleSequential().interpolator(d3.interpolateTurbo)
it uses:
scale = d3.scaleLinear().interpolate(() => d3.interpolateTurbo)
https://github.com/observablehq/plot/blob/98d846e868e0c30bf3b55249c8ebb3308ea15440/src/scales/quantitative.js#L67-L87
  // Sometimes interpolate is a named interpolator, such as "lab" for Lab color
  // space. Other times interpolate is a function that takes two arguments and
  // is used in conjunction with the range. And other times the interpolate
  // function is a “fixed” interpolator on the [0, 1] interval, as when a
  // color scheme such as interpolateRdBu is used.
  if (typeof interpolate !== "function") {
    interpolate = Interpolator(interpolate);
  }
  if (interpolate.length === 1) {
    if (reverse) {
      interpolate = flip(interpolate);
      reverse = false;
    }
    if (range === undefined) {
      range = Float64Array.from(domain, (_, i) => i / (domain.length - 1));
      if (range.length === 2) range = unit; // optimize common case of [0, 1]
    }
    scale.interpolate((range === unit ? constant : interpolatePiecewise)(interpolate));
  } else {
    scale.interpolate(interpolate);
  }
In this PR, I'm trying to implement the same approach for Time and UTC scales in vega. It look like it does the job, but it feels quite hacky, so I doubt it should be merged as is. I just wanted to understand and demonstrate where does the problem come from and how it could be fixed. But probably there could be a more beautiful solution.
Here is demonstration how it works: https://observablehq.com/d/0af4e109ae46ffc3
https://user-images.githubusercontent.com/4602302/164261164-7137c287-e7cc-456c-b78e-bae9c44587f0.mov