Support for Alluvial diagram a.k.a Sankey chart
I am submitting a feature request. I would love to see Vega support for Sankey chart in addition to Chord chart #398
This request is not a high-priority item for the Vega team at the moment. However, we would be more than happy to review any 3rd party contributions of a new module (similar to vega-voronoi, vega-wordcloud, etc) that adds a new transform for Sankey diagram layout, and we would be happy to help advise anyone interested in doing that work!
Jeffrey,
Thanks for the reply. I assume the code for vega-voronoi and vega-wordcloud is accessible in github. We will look into it. If there is any chance you could just provide direction for getting started, it would be appreciated.
Are you part of the UW IDL team? If so, the organization I support is interested in reaching out to the IDL.
Barbara Giordano [email protected]
[image: www.novetta.com]
Barbara Giordano
Sr Data Computer Scientist
500 E Zack Street, 7th Floor
Tampa, FL 33602
Email [email protected]
Office 813-304-2942
Mobile 301-788-3946
On Wed, Feb 7, 2018 at 4:36 PM, Jeffrey Heer [email protected] wrote:
This request is not a high-priority item for the Vega team at the moment. However, we would be more than happy to review any 3rd party contributions of a new module (similar to vega-voronoi, vega-wordcloud, etc) that adds a new transform for Sankey diagram layout, and we would be happy to help advise anyone interested in doing that work!
— You are receiving this because you commented. Reply to this email directly, view it on GitHub https://github.com/vega/vega/issues/1020#issuecomment-363918849, or mute the thread https://github.com/notifications/unsubscribe-auth/ANGFVUCgoP00rt5E84U7Ll_JDesimAaeks5tShdmgaJpZM4PnEkz .
@bfgiordano, @sukeshlaghate I actually made a 2-level sankey chart with Vega 3 -- https://nyurik.github.io/Vega-Sankey-Graph-for-Kibana/ and it should be fairly easy to make it into multi-level one. I'm not sure if Vega needs an additional transform for that.
Yuri -
That is awesome - thank you. Will definitely check it out.
Barbara
[image: www.novetta.com]
Barbara Giordano
Sr Data Computer Scientist
500 E Zack Street, 7th Floor
Tampa, FL 33602
Email [email protected]
Office 813-304-2942
Mobile 301-788-3946
On Mon, Feb 19, 2018 at 7:32 PM, Yuri Astrakhan [email protected] wrote:
@bfgiordano https://github.com/bfgiordano I actually made a 2-level sankey chart with Vega 3 -- https://nyurik.github.io/Vega- Sankey-Graph-for-Kibana/ and it should be fairly easy to make it into multi-level one. I'm not sure if Vega needs an additional transform for that.
— You are receiving this because you were mentioned. Reply to this email directly, view it on GitHub https://github.com/vega/vega/issues/1020#issuecomment-366834346, or mute the thread https://github.com/notifications/unsubscribe-auth/ANGFVchp9IZrRAK50NKfCN37kcGSmr5Tks5tWhKJgaJpZM4PnEkz .
google charts does a great job with Multilevel Sankey diagrams and ease of implementation. https://developers.google.com/chart/interactive/docs/gallery/sankey
@nyurik Do you have example or direction to start making multi-level one, as I am not finding it all that easy to convert your example, which has been great help but has been just out of reach to extend to multi-level so far.
anyone who have done multi-level sankey, could you please share your code or your approach.
I have tried @nyurik method but i had no luck. Also tried parallel coordinates example but it dint look like sankey.
Any help would be great.
@vikkya, I can share my Vega code that creates a three column sankey, though all i did was take the code from the Elastic Blog and guess my way to success...or at least as close as we can get to it in Kibana Vega. How/Where do you want it?
Would it be possible to integrate d3-sankey?
Has any further consideration been given to implementing Sankey charts in Vega? Is it on the road map at all?
I suspect this this feature awaits community contribution - anyone who wants to implement it can submit it, and @jheer is likely to merge it. This feature is probably similar to many other d3 wrappers that Vega has.
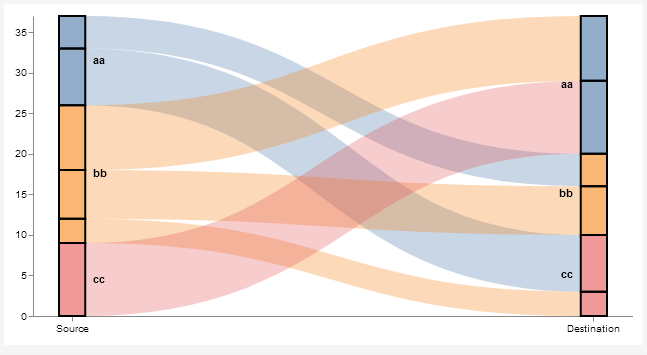
For anyone else looking for this, I recreated @nyurik example from his blog post replacing the HJSON and fixing the input data slightly. I think this would be a good to add to official the examples.
{
  "$schema": "https://vega.github.io/schema/vega/v5.2.json",
  "height": 300,
  "width": 600,
  "data": [
    {
      "name": "rawData",
      "values": [
        {"key": {"stk1": "aa", "stk2": "cc"}, "doc_count": 7},
        {"key": {"stk1": "aa", "stk2": "bb"}, "doc_count": 4},
        {"key": {"stk1": "bb", "stk2": "aa"}, "doc_count": 8},
        {"key": {"stk1": "bb", "stk2": "bb"}, "doc_count": 6},
        {"key": {"stk1": "bb", "stk2": "cc"}, "doc_count": 3},
        {"key": {"stk1": "cc", "stk2": "aa"}, "doc_count": 9}
      ],
      "transform": [
        {"type": "formula", "expr": "datum.key.stk1", "as": "stk1"},
        {"type": "formula", "expr": "datum.key.stk2", "as": "stk2"},
        {"type": "formula", "expr": "datum.doc_count", "as": "size"}
      ]
    },
    {
      "name": "nodes",
      "source": "rawData",
      "transform": [
        {
          "type": "filter",
          "expr": "!groupSelector || groupSelector.stk1 == datum.stk1 || groupSelector.stk2 == datum.stk2"
        },
        {"type": "formula", "expr": "datum.stk1+datum.stk2", "as": "key"},
        {"type": "fold", "fields": ["stk1", "stk2"], "as": ["stack", "grpId"]},
        {
          "type": "formula",
          "expr": "datum.stack == 'stk1' ? datum.stk1+' '+datum.stk2 : datum.stk2+' '+datum.stk1",
          "as": "sortField"
        },
        {
          "type": "stack",
          "groupby": ["stack"],
          "sort": {"field": "sortField", "order": "descending"},
          "field": "size"
        },
        {"type": "formula", "expr": "(datum.y0+datum.y1)/2", "as": "yc"}
      ]
    },
    {
      "name": "groups",
      "source": "nodes",
      "transform": [
        {
          "type": "aggregate",
          "groupby": ["stack", "grpId"],
          "fields": ["size"],
          "ops": ["sum"],
          "as": ["total"]
        },
        {
          "type": "stack",
          "groupby": ["stack"],
          "sort": {"field": "grpId", "order": "descending"},
          "field": "total"
        },
        {"type": "formula", "expr": "scale('y', datum.y0)", "as": "scaledY0"},
        {"type": "formula", "expr": "scale('y', datum.y1)", "as": "scaledY1"},
        {
          "type": "formula",
          "expr": "datum.stack == 'stk1'",
          "as": "rightLabel"
        },
        {
          "type": "formula",
          "expr": "datum.total/domain('y')[1]",
          "as": "percentage"
        }
      ]
    },
    {
      "name": "destinationNodes",
      "source": "nodes",
      "transform": [{"type": "filter", "expr": "datum.stack == 'stk2'"}]
    },
    {
      "name": "edges",
      "source": "nodes",
      "transform": [
        {"type": "filter", "expr": "datum.stack == 'stk1'"},
        {
          "type": "lookup",
          "from": "destinationNodes",
          "key": "key",
          "fields": ["key"],
          "as": ["target"]
        },
        {
          "type": "linkpath",
          "orient": "horizontal",
          "shape": "diagonal",
          "sourceY": {"expr": "scale('y', datum.yc)"},
          "sourceX": {"expr": "scale('x', 'stk1') + bandwidth('x')"},
          "targetY": {"expr": "scale('y', datum.target.yc)"},
          "targetX": {"expr": "scale('x', 'stk2')"}
        },
        {
          "type": "formula",
          "expr": "range('y')[0]-scale('y', datum.size)",
          "as": "strokeWidth"
        },
        {
          "type": "formula",
          "expr": "datum.size/domain('y')[1]",
          "as": "percentage"
        }
      ]
    }
  ],
  "scales": [
    {
      "name": "x",
      "type": "band",
      "range": "width",
      "domain": ["stk1", "stk2"],
      "paddingOuter": 0.05,
      "paddingInner": 0.95
    },
    {
      "name": "y",
      "type": "linear",
      "range": "height",
      "domain": {"data": "nodes", "field": "y1"}
    },
    {
      "name": "color",
      "type": "ordinal",
      "range": "category",
      "domain": {"data": "rawData", "field": "stk1"}
    },
    {
      "name": "stackNames",
      "type": "ordinal",
      "range": ["Source", "Destination"],
      "domain": ["stk1", "stk2"]
    }
  ],
  "axes": [
    {
      "orient": "bottom",
      "scale": "x",
      "encode": {
        "labels": {
          "update": {"text": {"scale": "stackNames", "field": "value"}}
        }
      }
    },
    {"orient": "left", "scale": "y"}
  ],
  "marks": [
    {
      "type": "path",
      "name": "edgeMark",
      "from": {"data": "edges"},
      "clip": true,
      "encode": {
        "update": {
          "stroke": [
            {
              "test": "groupSelector && groupSelector.stack=='stk1'",
              "scale": "color",
              "field": "stk2"
            },
            {"scale": "color", "field": "stk1"}
          ],
          "strokeWidth": {"field": "strokeWidth"},
          "path": {"field": "path"},
          "strokeOpacity": {
            "signal": "!groupSelector && (groupHover.stk1 == datum.stk1 || groupHover.stk2 == datum.stk2) ? 0.9 : 0.3"
          },
          "zindex": {
            "signal": "!groupSelector && (groupHover.stk1 == datum.stk1 || groupHover.stk2 == datum.stk2) ? 1 : 0"
          },
          "tooltip": {
            "signal": "datum.stk1 + ' → ' + datum.stk2 + '    ' + format(datum.size, ',.0f') + '   (' + format(datum.percentage, '.1%') + ')'"
          }
        },
        "hover": {"strokeOpacity": {"value": 1}}
      }
    },
    {
      "type": "rect",
      "name": "groupMark",
      "from": {"data": "groups"},
      "encode": {
        "enter": {
          "fill": {"scale": "color", "field": "grpId"},
          "width": {"scale": "x", "band": 1}
        },
        "update": {
          "x": {"scale": "x", "field": "stack"},
          "y": {"field": "scaledY0"},
          "y2": {"field": "scaledY1"},
          "fillOpacity": {"value": 0.6},
          "tooltip": {
            "signal": "datum.grpId + '   ' + format(datum.total, ',.0f') + '   (' + format(datum.percentage, '.1%') + ')'"
          }
        },
        "hover": {"fillOpacity": {"value": 1}}
      }
    },
    {
      "type": "text",
      "from": {"data": "groups"},
      "interactive": false,
      "encode": {
        "update": {
          "x": {
            "signal": "scale('x', datum.stack) + (datum.rightLabel ? bandwidth('x') + 8 : -8)"
          },
          "yc": {"signal": "(datum.scaledY0 + datum.scaledY1)/2"},
          "align": {"signal": "datum.rightLabel ? 'left' : 'right'"},
          "baseline": {"value": "middle"},
          "fontWeight": {"value": "bold"},
          "text": {
            "signal": "abs(datum.scaledY0-datum.scaledY1) > 13 ? datum.grpId : ''"
          }
        }
      }
    },
    {
      "type": "group",
      "data": [
        {
          "name": "dataForShowAll",
          "values": [{}],
          "transform": [{"type": "filter", "expr": "groupSelector"}]
        }
      ],
      "encode": {
        "enter": {
          "xc": {"signal": "width/2"},
          "y": {"value": 30},
          "width": {"value": 80},
          "height": {"value": 30}
        }
      },
      "marks": [
        {
          "type": "group",
          "name": "groupReset",
          "from": {"data": "dataForShowAll"},
          "encode": {
            "enter": {
              "cornerRadius": {"value": 6},
              "fill": {"value": "#f5f5f5"},
              "stroke": {"value": "#c1c1c1"},
              "strokeWidth": {"value": 2},
              "height": {"field": {"group": "height"}},
              "width": {"field": {"group": "width"}}
            },
            "update": {"opacity": {"value": 1}},
            "hover": {"opacity": {"value": 0.7}}
          },
          "marks": [
            {
              "type": "text",
              "interactive": false,
              "encode": {
                "enter": {
                  "xc": {"field": {"group": "width"}, "mult": 0.5},
                  "yc": {
                    "field": {"group": "height"},
                    "mult": 0.5,
                    "offset": 2
                  },
                  "align": {"value": "center"},
                  "baseline": {"value": "middle"},
                  "fontWeight": {"value": "bold"},
                  "text": {"value": "Show All"}
                }
              }
            }
          ]
        }
      ]
    },
    {
      "type": "rect",
      "from": {"data": "nodes"},
      "encode": {
        "enter": {
          "stroke": {"value": "#000"},
          "strokeWidth": {"value": 2},
          "width": {"scale": "x", "band": 1},
          "x": {"scale": "x", "field": "stack"},
          "y": {"field": "y0", "scale": "y"},
          "y2": {"field": "y1", "scale": "y"}
        }
      }
    }
  ],
  "signals": [
    {
      "name": "groupHover",
      "value": {},
      "on": [
        {
          "events": "@groupMark:mouseover",
          "update": "{stk1:datum.stack=='stk1' && datum.grpId, stk2:datum.stack=='stk2' && datum.grpId}"
        },
        {"events": "mouseout", "update": "{}"}
      ]
    },
    {
      "name": "groupSelector",
      "value": false,
      "on": [
        {
          "events": "@groupMark:click!",
          "update": "{stack:datum.stack, stk1:datum.stack=='stk1' && datum.grpId, stk2:datum.stack=='stk2' && datum.grpId}"
        },
        {
          "events": [
            {"type": "click", "markname": "groupReset"},
            {"type": "dblclick"}
          ],
          "update": "false"
        }
      ]
    }
  ]
}
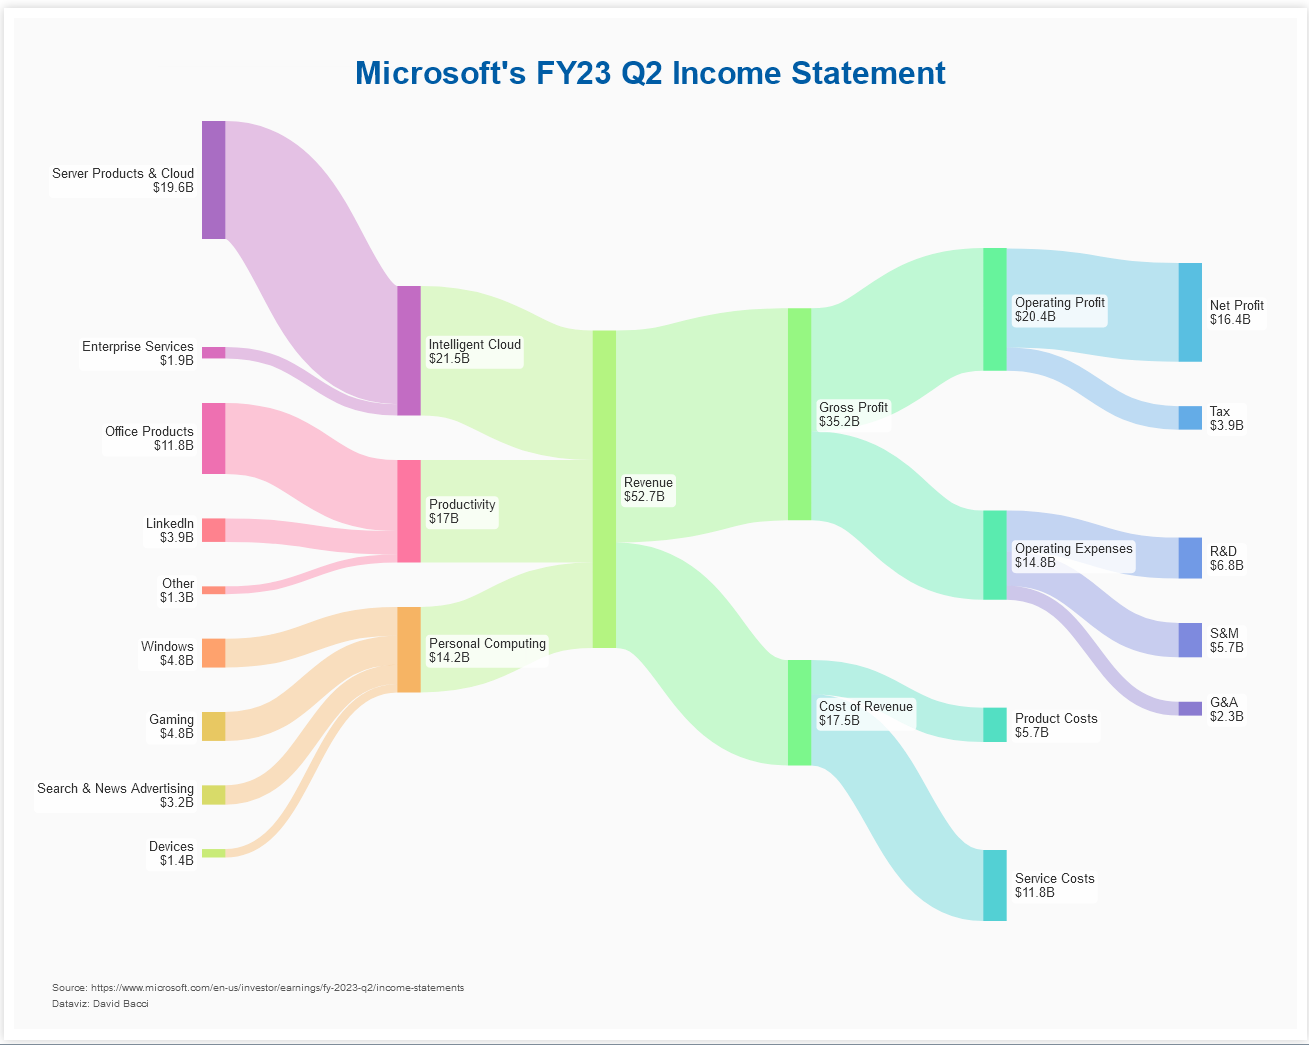
I finally made a proper Sankey Chart. Possibly a useful example for the main page - @domoritz , let me know if you want a PR. I think this issue could potentially be closed although there are some improvements to the transforms which would make creating these a lot easier.
{
  "$schema": "https://vega.github.io/schema/vega/v5.json",
  "description": "Sankey Chart by David Bacci: https://www.linkedin.com/in/davbacci/",
  "width": 1000,
  "height": 800,
  "padding": {"bottom": 20, "left": 20, "right": 30, "top": 40},
  "title": {
    "text": "Microsoft's FY23 Q2 Income Statement",
    "color": "#005ca5",
    "fontSize": 32,
    "dy": 0,
    "fontWeight": "bold",
    "offset": 30
  },
  "background": "#fafafa",
  "signals": [
    {
      "name": "standardGap",
      "value": 14,
      "description": "Gap as a percentage of full domain"
    },
    {
      "name": "base",
      "value": "center",
      "description": "How to stack(center or zero)"
    }
  ],
  "data": [
    {
      "name": "input",
      "values": [
        {
          "category": "Server Products & Cloud",
          "stack": 1,
          "sort": 1,
          "labels": "left"
        },
        {
          "category": "Enterprise Services",
          "stack": 1,
          "sort": 2,
          "labels": "left",
          "gap": 20
        },
        {
          "category": "Office Products",
          "stack": 1,
          "sort": 3,
          "labels": "left"
        },
        {"category": "LinkedIn", "stack": 1, "sort": 4, "labels": "left"},
        {"category": "Other", "stack": 1, "sort": 5, "labels": "left"},
        {"category": "Windows", "stack": 1, "sort": 6, "labels": "left"},
        {"category": "Gaming", "stack": 1, "sort": 7, "labels": "left"},
        {
          "category": "Search & News Advertising",
          "stack": 1,
          "sort": 8,
          "labels": "left"
        },
        {"category": "Devices", "stack": 1, "sort": 9, "labels": "left"},
        {"category": "Intelligent Cloud", "stack": 2, "sort": 1},
        {"category": "Productivity", "stack": 2, "sort": 2},
        {"category": "Personal Computing", "stack": 2, "sort": 3},
        {"category": "Revenue", "stack": 3},
        {"category": "Gross Profit", "stack": 4, "sort": 1, "gap": 30},
        {"category": "Cost of Revenue", "stack": 4, "sort": 2, "gap": 30},
        {"category": "Operating Profit", "stack": 5, "sort": 1, "gap": 60},
        {"category": "Operating Expenses", "stack": 5, "sort": 2, "gap": 30},
        {"category": "Product Costs", "stack": 5, "sort": 3, "gap": 20},
        {"category": "Service Costs", "stack": 5, "sort": 4, "gap": 20},
        {"category": "Net Profit", "stack": 6, "sort": 1, "gap": 0},
        {"category": "Tax", "stack": 6, "sort": 2, "gap": 0},
        {"category": "R&D", "stack": 6, "sort": 3, "gap": 20},
        {"category": "S&M", "stack": 6, "sort": 4, "gap": 0},
        {"category": "G&A", "stack": 6, "sort": 5, "gap": 0},
        {
          "source": "Server Products & Cloud",
          "destination": "Intelligent Cloud",
          "value": 19.6
        },
        {
          "source": "Enterprise Services",
          "destination": "Intelligent Cloud",
          "value": 1.9
        },
        {
          "source": "Office Products",
          "destination": "Productivity",
          "value": 11.8
        },
        {"source": "LinkedIn", "destination": "Productivity", "value": 3.9},
        {"source": "Other", "destination": "Productivity", "value": 1.3},
        {
          "source": "Windows",
          "destination": "Personal Computing",
          "value": 4.8
        },
        {"source": "Gaming", "destination": "Personal Computing", "value": 4.8},
        {
          "source": "Search & News Advertising",
          "destination": "Personal Computing",
          "value": 3.2
        },
        {
          "source": "Devices",
          "destination": "Personal Computing",
          "value": 1.4
        },
        {
          "source": "Intelligent Cloud",
          "destination": "Revenue",
          "value": 21.5
        },
        {"source": "Productivity", "destination": "Revenue", "value": 17},
        {
          "source": "Personal Computing",
          "destination": "Revenue",
          "value": 14.2
        },
        {"source": "Revenue", "destination": "Gross Profit", "value": 35.2},
        {"source": "Revenue", "destination": "Cost of Revenue", "value": 17.5},
        {
          "source": "Gross Profit",
          "destination": "Operating Profit",
          "value": 20.4
        },
        {
          "source": "Gross Profit",
          "destination": "Operating Expenses",
          "value": 14.8
        },
        {
          "source": "Cost of Revenue",
          "destination": "Product Costs",
          "value": 5.7
        },
        {
          "source": "Cost of Revenue",
          "destination": "Service Costs",
          "value": 11.8
        },
        {
          "source": "Operating Profit",
          "destination": "Net Profit",
          "value": 16.4
        },
        {"source": "Operating Profit", "destination": "Tax", "value": 3.9},
        {"source": "Operating Expenses", "destination": "R&D", "value": 6.8},
        {"source": "Operating Expenses", "destination": "S&M", "value": 5.7},
        {"source": "Operating Expenses", "destination": "G&A", "value": 2.3}
      ]
    },
    {
      "name": "stacks",
      "source": "input",
      "transform": [
        {"type": "filter", "expr": "datum.source != null"},
        {"type": "formula", "as": "end", "expr": "['source','destination']"},
        {
          "type": "formula",
          "as": "name",
          "expr": "[ datum.source,datum.destination]"
        },
        {"type": "project", "fields": ["end", "name", "value"]},
        {"type": "flatten", "fields": ["end", "name"]},
        {
          "type": "lookup",
          "from": "input",
          "key": "category",
          "values": ["stack", "sort", "gap", "labels"],
          "fields": ["name"],
          "as": ["stack", "sort", "gap", "labels"]
        },
        {
          "type": "aggregate",
          "fields": ["value", "stack", "sort", "gap", "labels"],
          "groupby": ["end", "name"],
          "ops": ["sum", "max", "max", "max", "max"],
          "as": ["value", "stack", "sort", "gap", "labels"]
        },
        {
          "type": "aggregate",
          "fields": ["value", "stack", "sort", "gap", "labels"],
          "groupby": ["name"],
          "ops": ["max", "max", "max", "max", "max"],
          "as": ["value", "stack", "sort", "gap", "labels"]
        },
        {"type": "formula", "as": "gap", "expr": "datum.gap?datum.gap:0"}
      ]
    },
    {
      "name": "maxValue",
      "source": ["stacks"],
      "transform": [
        {
          "type": "aggregate",
          "fields": ["value"],
          "groupby": ["stack"],
          "ops": ["sum"],
          "as": ["value"]
        },
        {
          "type": "aggregate",
          "fields": ["value"],
          "ops": ["max"],
          "as": ["value"]
        }
      ]
    },
    {
      "name": "plottedStacks",
      "source": ["stacks"],
      "transform": [
        {
          "type": "formula",
          "as": "spacer",
          "expr": " (data('maxValue')[0].value/100)*(standardGap+datum.gap)"
        },
        {"type": "formula", "as": "type", "expr": "['data','spacer']"},
        {
          "type": "formula",
          "as": "spacedValue",
          "expr": "[datum.value,datum.spacer]"
        },
        {"type": "flatten", "fields": ["type", "spacedValue"]},
        {
          "type": "stack",
          "groupby": ["stack"],
          "sort": {"field": "sort", "order": "descending"},
          "field": "spacedValue",
          "offset": {"signal": "base"}
        },
        {"type": "formula", "expr": "((datum.value)/2)+datum.y0", "as": "yc"}
      ]
    },
    {
      "name": "finalTable",
      "source": ["plottedStacks"],
      "transform": [{"type": "filter", "expr": "datum.type == 'data'"}]
    },
    {
      "name": "linkTable",
      "source": ["input"],
      "transform": [
        {"type": "filter", "expr": "datum.source != null"},
        {
          "type": "lookup",
          "from": "finalTable",
          "key": "name",
          "values": ["y0", "y1", "stack", "sort"],
          "fields": ["source"],
          "as": ["sourceStacky0", "sourceStacky1", "sourceStack", "sourceSort"]
        },
        {
          "type": "lookup",
          "from": "finalTable",
          "key": "name",
          "values": ["y0", "y1", "stack", "sort"],
          "fields": ["destination"],
          "as": [
            "destinationStacky0",
            "destinationStacky1",
            "destinationStack",
            "destinationSort"
          ]
        },
        {
          "type": "stack",
          "groupby": ["source"],
          "sort": {"field": "destinationSort", "order": "descending"},
          "field": "value",
          "offset": "zero",
          "as": ["syi0", "syi1"]
        },
        {
          "type": "formula",
          "expr": "datum.syi0+datum.sourceStacky0",
          "as": "sy0"
        },
        {"type": "formula", "expr": "datum.sy0+datum.value", "as": "sy1"},
        {
          "type": "stack",
          "groupby": ["destination"],
          "sort": {"field": "sourceSort", "order": "descending"},
          "field": "value",
          "offset": "zero",
          "as": ["dyi0", "dyi1"]
        },
        {
          "type": "formula",
          "expr": "datum.dyi0+datum.destinationStacky0",
          "as": "dy0"
        },
        {"type": "formula", "expr": "datum.dy0+datum.value", "as": "dy1"},
        {"type": "formula", "expr": "((datum.value)/2)+datum.sy0", "as": "syc"},
        {"type": "formula", "expr": "((datum.value)/2)+datum.dy0", "as": "dyc"},
        {
          "type": "linkpath",
          "orient": "horizontal",
          "shape": "diagonal",
          "sourceY": {"expr": "scale('y', datum.syc)"},
          "sourceX": {
            "expr": "scale('x', toNumber(  datum.sourceStack))+ bandwidth('x')"
          },
          "targetY": {"expr": "scale('y', datum.dyc)"},
          "targetX": {"expr": "scale('x', datum.destinationStack)"}
        },
        {
          "type": "formula",
          "expr": "range('y')[0]-scale('y', datum.value)",
          "as": "strokeWidth"
        }
      ]
    }
  ],
  "scales": [
    {
      "name": "x",
      "type": "band",
      "range": "width",
      "domain": {"data": "finalTable", "field": "stack"},
      "paddingInner": 0.88
    },
    {
      "name": "y",
      "type": "linear",
      "range": "height",
      "domain": {"data": "finalTable", "field": "y1"},
      "reverse": false
    },
    {
      "name": "color",
      "type": "ordinal",
      "range": {"scheme": "rainbow"},
      "domain": {"data": "stacks", "field": "name"}
    }
  ],
  "marks": [
    {
      "type": "rect",
      "from": {"data": "finalTable"},
      "encode": {
        "update": {
          "x": {"scale": "x", "field": "stack"},
          "width": {"scale": "x", "band": 1},
          "y": {"scale": "y", "field": "y0"},
          "y2": {"scale": "y", "field": "y1"},
          "fill": {"scale": "color", "field": "name"},
          "fillOpacity": {"value": 0.75},
          "strokeWidth": {"value": 0},
          "stroke": {"scale": "color", "field": "name"}
        },
        "hover": {"tooltip": {"signal": "datum"}, "fillOpacity": {"value": 1}}
      }
    },
    {
      "type": "path",
      "name": "links",
      "from": {"data": "linkTable"},
      "clip": true,
      "encode": {
        "update": {
          "strokeWidth": {"field": "strokeWidth"},
          "path": {"field": "path"},
          "strokeOpacity": {"signal": "0.3"},
          "stroke": {"field": "destination", "scale": "color"}
        },
        "hover": {"strokeOpacity": {"value": 1}, "tooltip": {"signal": "datum"}}
      }
    },
    {
      "type": "group",
      "name": "labelText",
      "zindex": 1,
      "from": {
        "facet": {
          "data": "finalTable",
          "name": "labelFacet",
          "groupby": ["name", "stack", "yc", "value", "labels"]
        }
      },
      "clip": false,
      "encode": {
        "update": {
          "strokeWidth": {"value": 1},
          "stroke": {"value": "red"},
          "x": {
            "signal": "datum.labels=='left'?scale('x', datum.stack)-8 : scale('x', datum.stack) + (bandwidth('x')) +8"
          },
          "yc": {"scale": "y", "signal": "datum.yc"},
          "width": {"signal": "0"},
          "height": {"signal": "0"},
          "fillOpacity": {"signal": "0.1"}
        }
      },
      "marks": [
        {
          "type": "text",
          "name": "heading",
          "from": {"data": "labelFacet"},
          "encode": {
            "update": {
              "x": {"value": 0},
              "y": {"value": -2},
              "text": {"field": "name"},
              "align": {"signal": "datum.labels=='left'?'right':'left'"},
              "fontWeight": {"value": "normal"}
            }
          }
        },
        {
          "type": "text",
          "name": "amount",
          "from": {"data": "labelFacet"},
          "encode": {
            "update": {
              "x": {"value": 0},
              "y": {"value": 12},
              "text": {"signal": " format(datum.value, '$') + 'B'"},
              "align": {"signal": "datum.labels=='left'?'right':'left'"}
            }
          }
        }
      ]
    },
    {
      "type": "rect",
      "from": {"data": "labelText"},
      "encode": {
        "update": {
          "x": {"field": "bounds.x1", "offset": -2},
          "x2": {"field": "bounds.x2", "offset": 2},
          "y": {"field": "bounds.y1", "offset": -2},
          "y2": {"field": "bounds.y2", "offset": 2},
          "fill": {"value": "white"},
          "opacity": {"value": 0.8},
          "cornerRadius": {"value": 4}
        }
      }
    },
    {
      "type": "text",
      "data": [{}],
      "encode": {
        "update": {
          "text": {
            "value": [
              "Source: https://www.microsoft.com/en-us/investor/earnings/fy-2023-q2/income-statements",
              "Dataviz: David Bacci"
            ]
          },
          "align": {"value": "left"},
          "lineHeight": {"value": 16},
          "fill": {"value": "#595959"},
          "x": {"signal": "-150"},
          "y": {"signal": "height +70"},
          "fontSize": {"value": 10}
        }
      }
    }
  ],
  "config": {"view": {"stroke": "transparent"}, "text": {"fontSize": 13,
  "fill":"#333333"


  }}
}